Thermodynamic processes in p v coordinates. Steam compressor refrigeration cycle. Adiabatic gas process
Each of these equations contains two factors. One characterizes the quality or intensity of energy ( ω2− square of speed, H- lifting height, T- temperature, p−pressure), and the second expresses the amount or capacity of the body in relation to a given energy ( m – body mass, V − specific volume, S – entropy). The first factor is an intensive factor, and the second one is an extensive factor. That is, entropy is the capacity of a thermodynamic system with respect to thermal tension.
Clausius formulated the first and second laws of thermodynamics.
The energy of the universe is constant.
The entropy of the universe tends to a maximum.
Thus, this should lead to the heat death of the universe when the temperature evens out. But this contradicts the fact that the law of entropy increase was obtained for isolated system.
TS - diagram.
In this diagram, temperature is plotted along the ordinate axis, and entropy is plotted along the abscissa axis.
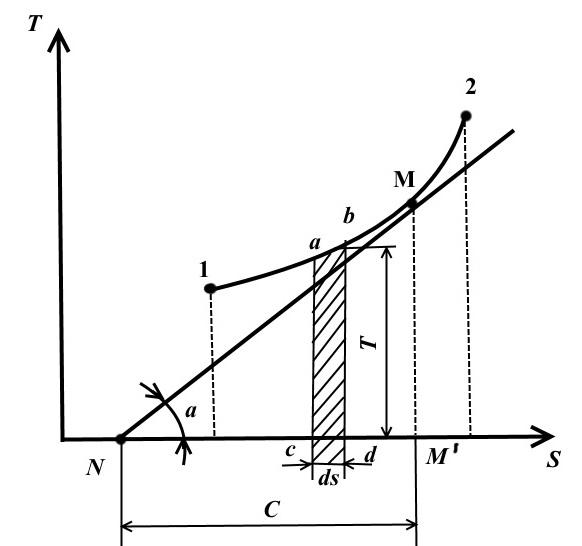
The equilibrium state in the TS - diagram is represented by points with coordinates corresponding to the values of temperature and entropy.
The reversible thermodynamic process of changing the state of the working fluid from the initial state 1 to the final state 2 is depicted in TS − diagram of a continuous curve passing between these points.
Square abdc is equal to TdS = dq , those. expresses the elementary amount of heat received or given off by the system in a reversible process.
The area under curve 1-2 is
That is, the area under the curve in TS − diagram, represents the heat supplied to the system or removed from it.
That's why TS − the diagram is called thermal.
Draw at an arbitrary point M on curve 1-2 tangent to this curve
The value represents the true heat capacity of the process.
![]()
Gas processes inTS − diagram.
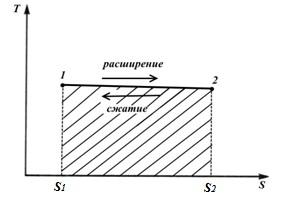
Isothermal process.
In an isothermal process T= const. That's why TS- in the diagram, it is depicted by a straight line parallel to the x-axis.
Taking into account the fact that dT=0 , the dependences of the change in the entropy of an ideal gas in an isothermal process will take the form
(the term on the right side leaves)
Process 1-2 is a process in which entropy increases, and therefore heat is supplied to the gas and the gas performs an expansion work equivalent to this heat.
Process 2-1 is a compression process in which heat equivalent to the work of compression is removed from the gas and the entropy is reduced
figure area S 1 12 S 2 corresponds to the amount of heat q to the supplied gas, and at the same time work l (isothermal process)
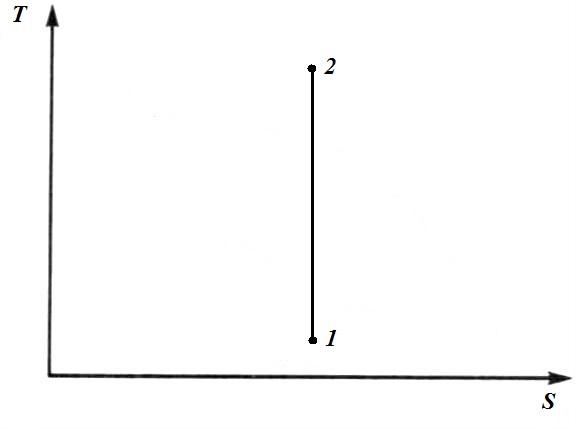
adiabatic process
In an adiabatic process q=0 and dq=0, and consequently dS=0.
Therefore, in an adiabatic process S= const and in TS− in the diagram, the adiabatic process is represented by a straight line parallel to the axis T.
Because in an adiabatic process S= const, then adiabatic reversible processes are also called isentropic.
During adiabatic compression, the temperature of the working fluid increases, and during expansion it decreases. Therefore process 1-2 is a contraction process and process 2-1 is an expansion process.
From the equation
![]() (3)
(3)
At k= const we get
![]()
For a reversible adiabatic process S 1 = S 2 = const, then from (*)
− adiabatic equation in coordinates p and V.
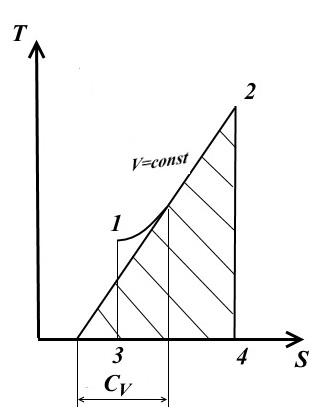
Isochoric process
For isochoric process V= const, dV=0.
At a constant heat capacity (from Eq. (1))
− view of TS - chart
The subtangent to the process curve at any point determines the value of the true heat capacity C V .
The subtangent will be positive only if the curve is convex downward.
Area under the 1-2 process curve TS - the diagram gives a scaled amount of heat supplied (or removed in the 2-1 process) q, equal to the change internal energy U 2 - U 1 .
isobaric process
In an isobaric process, the pressure is constant. p= const
In this case
![]() from (2)
from (2)
Therefore, at p= const as with V= const the isobar is a logarithmic curve, the trace rises to the right and is convex downward.
The tangent to curve 1-2 at any point gives the values of the true heat capacity C p .
The area under the curve gives the amount of heat q, which is reported to the gas at p= const, equal to enthalpy change i 2 - i 1 .
Polytropic process
In a polytropic process. Heat capacity in this process
![]()
Hence, for the final change in the state of the gas
![]()
The polytropic process TS - the diagram is depicted by a curve, the location of which depends on the indicator n.
circular process. Carnot cycle.
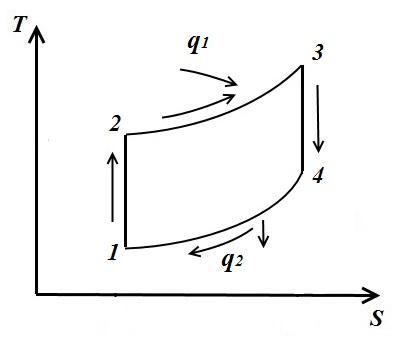
Let's depict in TS – diagram of an arbitrary reversible cycle 1 a2 b1 .

In the process 1 a2 the working body receives the amount of heat q 1 , numerically equal to the area under the curve 1 a2, and in the process 2- b-1 gives the amount of heat q 2 , numerically equal to the area under the curve 2- b-1.
Part of the warmth
goes into cycle l (∆ u=0 in the loop).
The work of the cycle is positive if the cycle passes clockwise and negative if it is counterclockwise (the direction of the cycle is in pVandTS− diagrams is the same).
Thermal efficiency circular process
The change in entropy in any cycle is zero.
The Carnot cycle consists of two isotherms and two adiabats. AT TS- in the diagram, it will be displayed as a rectangle (horizontal lines are isotherms, vertical lines are adiabats)
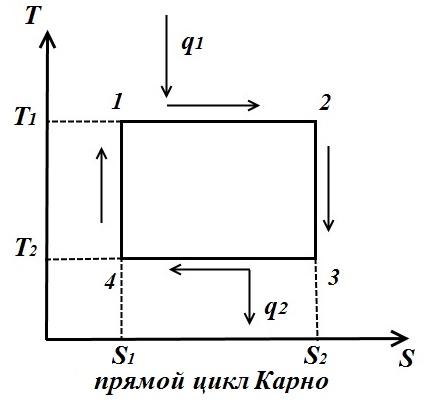
The amount of heat supplied to the working fluid is numerically equal to the area of the rectangle 12 S 2 S 1 :
The amount of heat transferred to the refrigerator corresponds to the area of the rectangle 34 S 1 S 2 :
Heat equivalent to the work of the cycle, equal to the area of the cycle
Thermal efficiency cycle
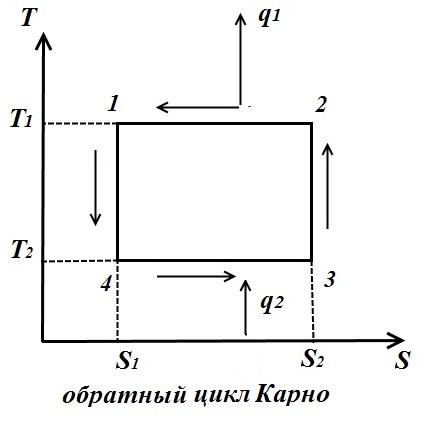
For the reverse cycle (fig. right)
Reverse cycle coefficient of performance
![]()
Average integral temperature
In an arbitrary reversible cycle, heat is supplied and removed at variable temperatures. To simplify thermodynamic studies, the concept of mean integral temperature is introduced.
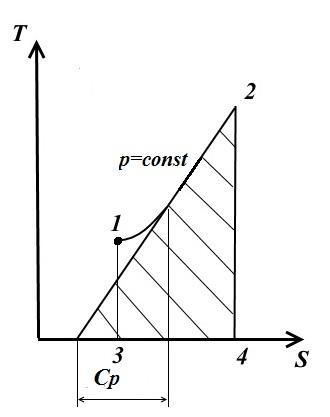
Consider an arbitrary polytropic process in TS- a diagram in which heat is supplied to the working fluid q(process 1-2).
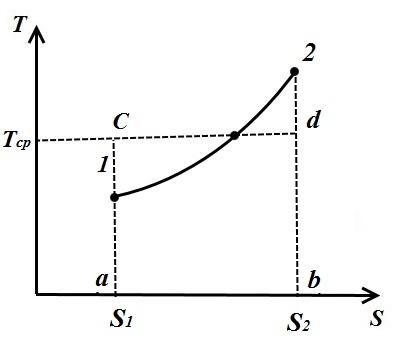
Under the average integral temperature of the working fluid in process 1-2 is understood the temperature, which is equal to the height of the rectangle abdc equal area a12 b under the process curve 1-2, i.e.
![]()
Because the
and the segment
Thus, the average integral gas temperature for any process is equal to the ratio of the quantity, heat, supplied to the gas or taken from it, to the change in entropy.
For any polytropic process
![]()
and mean integral temperature (from (*))

This shows that the average integral temperature in any polytropic process depends only on the initial T 1 and final T 2 temperatures and does not depend on the nature of the process.
In an arbitrary cycle in which the compression and expansion of the gas are adiabatic (sections 1-2, 3-4), the amount of heat supplied to section 2-3
and withdrawn at section 4-1
Then the thermal efficiency cycle
![]() ,
,
i.e. thermal efficiency arbitrary cycle is equal to thermal efficiency. Carnot cycle, carried out between the average integral temperatures of the processes, summing up T 1 cp and taking T 2 cp warmth.
Generalized Carnot cycle
The Carnot cycle has the highest thermal efficiency. however, other cycles are also possible, which, under certain additional conditions, can have a thermal efficiency equal to the efficiency. the Carnot cycle.
Consider an example of such a cycle in Fig. shows the Carnot cycle 1-2-3-4, consisting of two adiabats 2-3, 4-1 and two isotherms 1-2, 3-4.
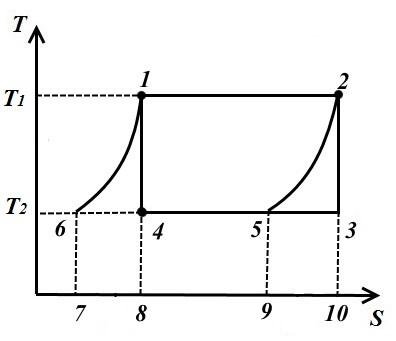
Draw two equidistant curves 1-6 and 2-5 from points 1 and 2 until they intersect with the isotherm T 2 = const and consider the inverse cycle 1-2-5-6, consisting of two isotherms and two equidistant curves 6-1 (polytropes) and 2-5.
In the process 1-2 to the working fluid at a temperature T 1 = const amount of heat supplied
In process 2-5, an amount of heat equal to the area of the figure 9-5-2-10 is removed from the working fluid.
In the process 5-6 from the working fluid at T 2 = const amount of heat removed
In process 6-1, the amount of heat is supplied to the working fluid q 6-1 , equal to the area of 7-6-1-8.
Since curves 1-6, 2-5 are equidistant, then sq. 7618 = pl. 952-10 therefore, the amount of heat is also the same.
This shows that the intermediate heat sinks and heat transmitters are only heat regenerators, which take heat from the working fluid in process 2-5, and give it in the same amount to the working fluid in process 6-1. Thus, 1-2-5-6 valid external sources are a heat transfer device with temperature T 1 and a heat sink with temperature T 2 .
Heat converted into work in a cycle
Thermal efficiency is determined by the formula
That is, the thermal efficiency considered cycle is equal to the efficiency. the Carnot cycle.
The thermodynamic cycle in which heat is removed from the working fluid in one or more processes of the cycle for the supply in one or more processes is called regenerative cycle.
Unlike the Carnot cycle, the regenerative cycle requires an intermediate heat storage source.
Thermodynamic temperature scale
When using various thermodynamic bodies, the scale is uneven due to the peculiarities of the thermal expansion of these substances.
The second law of thermodynamics allows you to build a temperature scale that does not depend on the properties of a thermometric body (proposed by Kelvin)
In the Carnot cycle, thermal efficiency does not depend on the properties of the working fluid, but is a function of the temperatures of the hot and cold source.
Thermal efficiency
Thus, the ratio of temperatures of the working fluid can be determined by the ratio of heat. It follows that if the Carnot cycles (Fig.) are formed using equidistant isotherms, then in these cycles the same amount of heat is converted into work.
![]()
Let the temperature isotherms T 0 and T k correspond to the temperatures of melting ice (0 °C) and boiling water (100 °C).
In the Carnot cycle 1234 heat is converted into work q equal to the area of the figure 1234 . If this area is divided by a grid of equidistant isotherms into 100 equal parts, in each of the resulting Carnot cycles, the amount of heat will be converted into work 0,01 q. The temperature interval between isotherms will be 1 °C.
Similarly, one can construct a scale that lies below the isotherm with temperature T 0 (0 °C).
The lower point of the thermodynamic scale is taken to be the temperature at which the thermal efficiency Carnot cycle =1. According to
at T 2 =0 . A lower temperature cannot exist, because in this case , which contradicts the second law of thermodynamics.
Consequently T=0 (-273.15 ) is the lowest possible temperature and can be taken as the initial constant natural point on the temperature scale. Thus, the absolute temperature cannot have negative values.
The thermodynamic temperature scale was obtained for an ideal gas.
In thermodynamics, a wide variety of processes are studied. However, they distinguish four main processes considered as reversible:
isochoric, flowing at constant volume;
isobaric, flowing at constant pressure;
isothermal, flowing at constant temperature(the name of the process comes from the combination of the Greek words "isos" - equal and "terme" - warmth);
adiabatic, flowing without the supply and removal of heat (in Greek "adiabatos" - impenetrable).
In addition to the listed four basic processes in thermodynamics, the so-called polytropic processes (in Greek "poly" - a lot, "tropos" - a way). In these processes, all parameters of the working fluid can change simultaneously and, in addition, heat is supplied or removed. As will be explained below, the four basic processes are special cases of the polytropic process.
Methodology for the study of thermodynamic processes
First of all, it should be noted that any gas process, which one
c = const is called polytropic with the general equation pvn= const.
n called the polytropic index.
The technique for studying thermodynamic processes is as follows:
1. Set the equation for this process and produce it graphic image in pv and Ts coordinate systems (the latter is discussed below).
2. Set the ratio between p,v and T.
3. According to the calculation formula common for all processes, we determine the change in internal energy ( du= c v dT).
4. By general equation work determines the work of a given thermodynamic process.
5. The heat of this process is determined by the formula q = .
Isochoric process
1. Polytropic equation pv n= const can be written as p v=const, which shows that for an isochoric process n takes the value.
2. From the equations of state p 1 v = RT 1 and p 2 v = RT 2 we get .
In practice, this process occurs as component processes occurring in internal combustion engines (explosion formation (fuel combustion) in carburetor engines) and during cooling or heating of gas in a cylinder (Fig. 9, a).
5.q = u those. all the heat supplied goes to increase the internal energy. The coefficient shows the share of heat used to change the internal energy; 1 –z shows how much of the heat input is used to do work. Isochora in T-s coordinates (Fig. 9, b) is depicted by a logarithmic curve (see 6.5).
isobaric process
1. From the polytropic equation pv n= const, it can be seen that it turns into the equation of the isobaric process ( R= const) when n= 0.
2. From the equations of state pv 1 = RT 1 and pv 2 = RT 2 we have
3. u= with v(T 2 – T 1). (47)
4. i.e. . (48)
5.dq = du + d . (49)
Let's determine how the supplied heat is distributed:
z = = ,
those. from all the heat supplied.
This process is integral part ICE cycles and gas turbines (Fig. 10). Isobar in T-s coordinates is depicted by a logarithmic curve that is flatter than the isochore (because with p > with v, see 6.5).
Isothermal process
1.T= const , pvn = const . From equations of state pv=RT it follows that for this process n should be equal to 1, i.e. pv= const. Isotherm in p-v coordinates is depicted by an isosceles hyperbola (Fig. 11, a), and in T-s coordinates - a straight line (Fig. 11, b).
2. p 1 v 1 = p 2 v 2 ; . (50)
3. du=0, t .to. dT= 0.
5. q= , in this process all the heat goes into work.
This is the most advantageous process for compressing compressors, as compression temperature is constant
z= 1 – z= 1.
adiabatic process
An adiabatic process is a process that does not exchange heat with the environment. All fast processes (shot, explosion, steam flow through the flow part of the turbine, etc.) come very close to adiabatic.
Because of this, in what follows, real thermal processes that proceed fairly quickly, with an acceptable engineering error, will be considered as adiabatic processes (for example, the processes of compression and expansion in heat engines).
1. dq = with v dT + pdv; dq= 0, then
with v dT + pdv = 0. (52)
Differentiate pv=R.T. Get pdv+vdp=RdT, where . Let's substitute the received dT in (52): . Divide by and get pdv= 0. However, = k-1, then pdv + vdp + (k– 1)pdv = 0.
pdv + vdp + kpdv – pdv= 0. Divide by p v: . We integrate and get ln p+ln v k= const or ln( p.v.k) = const. AT final form the adiabatic equation is obtained:
pv k = const . (53)
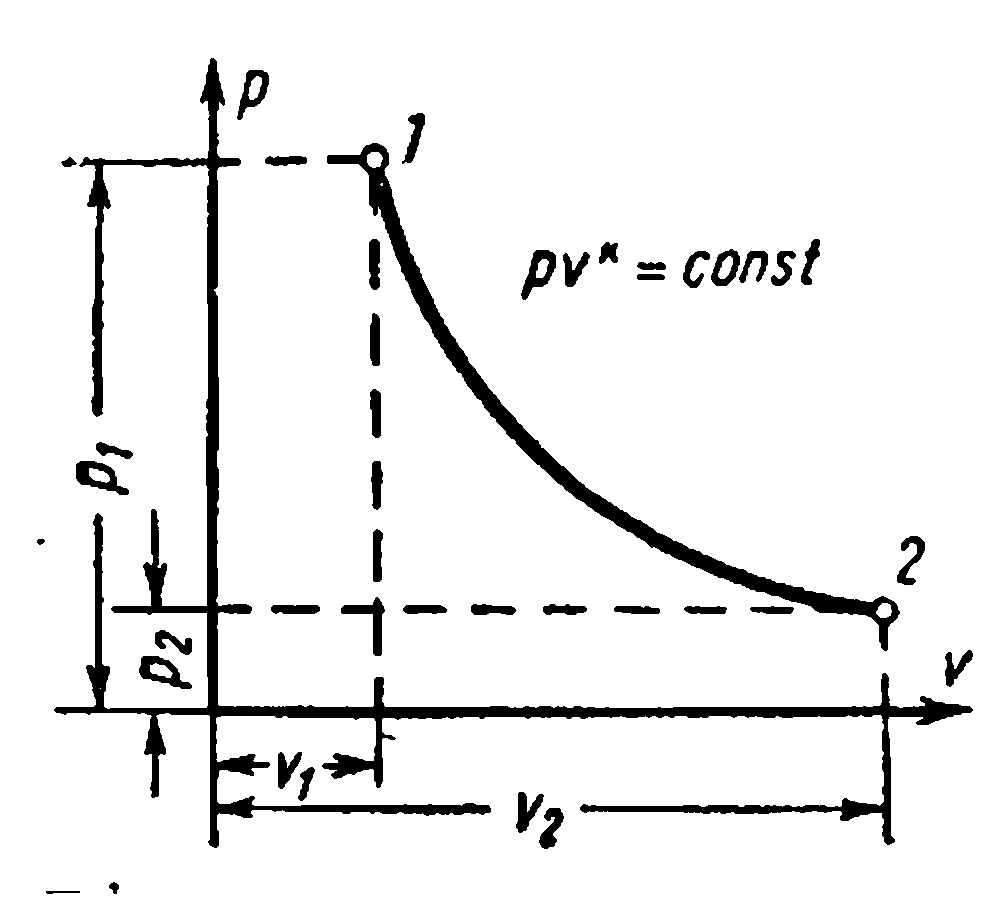
AT p-v adiabatic coordinates is an unequal-sided hyperbola going steeper than the isotherm ( n=k= 1.4, fig. 12a).
2. From the adiabatic equation p 1 v 1 k = p 2 v 2 k. . From here
We write the characteristic equation for points 1 and 2: p 1 v 1 =RT 1 and p 2 v 2 =RT 2 and divide the first by the second. Get
Now let's use expression (54), substituting it into expression (55):
To obtain the relationship between temperatures and pressures, we substitute into (55) , expressed through the pressure ratio from (54):
3, 4. In the adiabatic process, the change in internal energy is used to do work: O = d + du, hence d = -du or .
After integration, we get or (because with the expansion )
From Mayer's equation c p – c v = R. c p = kc v. From here kcv – cv = R and .
Substitute the resulting value c v into formula (58):
From the Clapeyron equation ( pv=RT) can be written down and taking p 1 v 1 outside the brackets, we get
5. q= 0.
In an adiabatic process, the entropy remains constant ( s= const), so this process is sometimes called isentropic (see 5.6).
Coefficient z doesn't make sense.
Polytropic process
All the processes considered above had a feature: in each of them, a restriction was imposed on any of the quantities ( R= const, t= const, v= const, dq= 0). Therefore, these processes can be considered special cases of changes in the state of the gas.
In addition, a consequence of these limitations is that the input or output heat q distributed between and in such a way that it takes on a certain value.
However, it is obvious that there may be processes in which there are no these restrictions and z can take on other values. The only limitation for such processes will be the persistence z, i.e. and constancy of heat capacity (because, q = With ).
By integrating it with n= const, we get the polytropic equation
pvn= const. (65)
As noted above, the indicator n takes on a specific value for each process.
Since the polytropic equation does not differ in form from the adiabatic equation, all relationships between the main parameters are represented by formulas similar to the adiabatic process
The same can be said about the expressions for determining the work of the polytropic process
n1.docx
*First law of dynamics.
Working body parameters p, V, T, U, i, S.
Internal energy of the working body
Internal energy of the working body. physical meaning and dimension.
Processes are reversible and irreversible. Equilibrium and non-equilibrium.
Enthalpy. physical properties.
Heat capacity of the working fluid
Isochoric gas process
Isobaric gas process.
Isothermal gas process.
adiabatic gas process.
Second law of thermodynamics
Formulations of the second law of thermodynamics.
Carnot cycle and its properties.
Water vapor tables.
i – S water vapor diagram.
adiabatic process p – V , i – S and T – S diagrams.
Multi-stage compression in the compressor.
ICE cycle with combustion at V= const
ICE cycle with combustion at p= const
ICE cycle with heat supply at Vandp = const
ICE cycle with mixed heat supply.
Cycle of a gas turbine plant
Steam power cycle. Rankine cycle.
Air compressor refrigeration cycle.
Steam compressor refrigeration cycle.
The vaporization process in p – V chart.
Process p = const water vapor. Process image in p – V , i – S and T – S diagrams.
Steam reheat.
Process T= const water vapor. Process image in p – V , i – S and T – S diagrams.
Tables of average heat capacities. Determination of heat using tables.
Specific consumption of steam and heat in steam power plants
Gas turbine plant cycle with regeneration.
The equation of state of the working fluid.
Mayer formula.
The concept of "Cooling coefficient".
The first law of thermodynamics is a special case of the general law of conservation and the transformation of energy in relation to the processes of mutual transformation of heat and work. The law states that the sum of all types of energy in an isolated system remains constant for any processes occurring in the system:
During the implementation of a thermodynamic process, the heat supplied to the body Q goes to change its internal energy and perform mechanical work:
For 1 kg working fluid
PARAMETERS OF THE WORKING BODYP , V , T , U , I , S .
The quantities characterizing the body in a given state are called parameters states. Most often, the state of the body is determined by the following parameters: specific volume, pressure, enthalpy and temperature.
Specific volume (v) body is the volume of a unit of its mass. In technical thermodynamics, a kilogram (kg) is taken as a unit of mass, and a cubic meter (m 3) is taken as a unit of volume. If a V - volume in m 3 occupied by the body mass M in kg, then the specific volume
Density is the reciprocal of the specific volume
pressure p in international system units (SI) are measured in pascals. Pascal (Pa) - pressure caused by a force of 1 newton (N), evenly distributed over a surface normal to it with an area of 1 m 2. Thus, in SI units, pascal is measured in newtons per square meter (N / m 2).
Temperature characterizes the degree of heated body. It is measured either on the thermodynamic temperature scale or on the international practical temperature scale. The unit of thermodynamic temperature is the kelvin (K), which is 1/273.16 of the thermodynamic temperature of the triple point of water.
Enthalpy
u and works pv .
Where dl t ( dl t = - vdp ).
Value i p , v , T , and. The physical meaning of the quantity i can be explained on the basis of the equation dq = di - vdp, which for the process p = const will be written as:
dq p = di . (86)
Whence it follows that di
The change in enthalpy in any process is determined only by the initial and final states of the body and does not depend on the nature of the process.
Entropy is a state function, therefore its change in the thermodynamic process is determined only by the initial and final values of the state parameters. Entropy change in basic thermodynamic processes:
in isochoric
in isobaric
in isothermal
in the adiabatic
in polytropic
INTERNAL ENERGY OF THE WORKING BODY, PHYSICAL MEANING AND DIMENSIONALITY.
Internal energy- this is all the energy contained in the body or system of bodies. This energy can be represented as the sum certain types energies: the kinetic energy of molecules, including the energy of translational and rotary motion molecules, and oscillatory motion atoms in the molecule itself; electron energy; intranuclear energy; energies of interaction between the nucleus of a molecule and electrons; potential energy or energy of the position of molecules in any external field of forces; energy of electromagnetic radiation.
The total internal energy of the body is usually denoted U(J) and the specific internal energy u (j/kg) .
The internal energy is:
Where is the internal kinetic energy molecules, internal potential energy molecules, is the constant of integration.
In technical thermodynamics, only such processes are considered in which the kinetic and potential components of internal energy change.
Change in the internal energy of an ideal gas for any process with an infinitesimal change in state (for 1 kg)
In thermal calculations, it is usually required to know the change in internal energy, and not its absolute value; therefore, the reference point (0 K or 0 0 C) for end result() irrelevant.
where is the average mass heat capacity at a constant volume within
Thus, the change in the internal energy of an ideal gas for any process is equal to the product of the average heat capacity at a constant volume and the temperature difference of the gas.
PROCESSES ARE REVERSIBLE AND IRREVERSIBLE. EQUILIBRIUM AND NON-EQUILIBRIUM
A thermodynamic process is a sequential change in the state of a body that occurs as a result of the energy interaction of the working fluid with the environment.
The concepts of reversible and irreversible thermodynamic process are closely related to the equilibrium of the system. Let us consider such a thermodynamic system in which there is no heat exchange with the environment (adiabatic thermodynamic system). The thermodynamic processes occurring in such a system are called reversible if the system returns to its original state during the direct and reverse processes without any additional thermal effect. environment to the system. If the system cannot return to its original state during the reverse process or this requires heat supply, then such a process is called irreversible.
The process with each change in pressure and temperature can only be reversible if, throughout the entire process from point to point of the thermodynamic system, the pressure is constant and the temperature at each point is equal to the ambient temperature or their difference is infinitely small.
Reversible thermodynamic processes are the ideal or theoretical case. All real processes are irreversible, since in practice it is difficult to satisfy the quasi-static condition. In addition, the irreversibility of the processes is caused by the presence of internal friction in the working fluid and surface friction in technical equipment (flow in the nozzle, friction of the piston surface against the cylinder wall, etc.). To overcome friction, it is always necessary to expend some amount of mechanical work, which in the course of the process is converted into heat.
ENTHALPY. PHYSICAL PROPERTIES
The enthalpy of a thermodynamic body is the sum of the internal energy u and works p v .
Where dl t - there is a difference in technical work ( dl t = - vdp ).
The resulting equation is also the second formulation of the first law of thermodynamics, using the concepts of enthalpy and technical work. 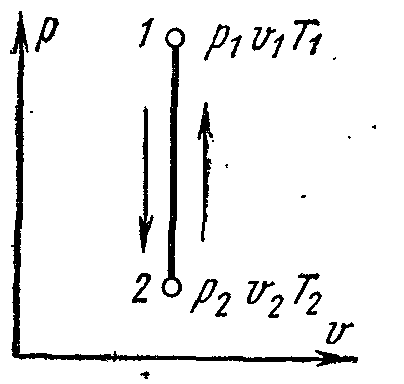
Value i can also be considered as a parameter of the state of a thermodynamic body along with the previously introduced p , v , T , u . The physical meaning of the quantity i can be explained based on the equation ( dq = di - vdp), which for the process p = const will be written as: dq p = di .
Whence it follows that di
is an elementary amount of heat supplied to a thermodynamic body in the process of constant pressure.
The change in enthalpy in any process is determined only by the initial and final states of the body and does not depend on the intermediate states and the nature of the process.
HEAT CAPACITY OF THE WORKING MEDIUM
heat capacity call the amount of heat that must be imparted to a body (gas) in order to raise the temperature of any quantitative unit by 1 ° C.
To determine the values of the heat capacities listed above, it is enough to know the value of one of them. It is most convenient to have the value of the molar heat capacity, then the mass heat capacity:
and the volumetric heat capacity:
Volumetric and mass heat capacities are interconnected by the dependence:
where is the gas density under normal conditions.
The heat capacity of a gas depends on its temperature. On this basis, one distinguishes average and true heat capacity.
If aq-
the amount of heat reported to a unit of gas quantity (or taken away from it) when the gas temperature changes from t 1
before t 2
then
Represents average heat capacity within. The limit of this ratio, when the temperature difference tends to zero, is called true heat capacity.
ISOCHORIC GAS PROCESS
Isochoric process- the process of communication or removal of heat at a constant volume of gas (
v
=
const).
At a constant volume, the pressure of a gas changes in direct proportion to the absolute temperatures:
External work of gas at v
=
const is zero l=0.
the amount of heat or change in the internal energy of the gas:
The isochoric process pv- chart displayed by a straight vertical line - isochore. With a positive amount of heat, the line goes from bottom to top.
The entropy change is:
ISOBARIC GAS PROCESS.
Isobaric process - the process of communication or removal of heat at constant pressure (R
= const)
The process curve is called an isobar.
Because in an isobaric process dp=0
then no technical work is performed in the system, and the amount of heat required to transfer the body from state 1 to state 2 is determined as:
Thus, in an isobaric thermodynamic process, the amount of heat supplied (removed) to the body is proportional to the change in enthalpy in this process. This conclusion is valid for both reversible and irreversible processes, provided that the system is in thermodynamic equilibrium at the beginning and end of the process.
For a reversible process:
isobaric process pv –
the diagram is displayed as a straight horizontal line. When heat is added to the process, the line extends from left to right.

Mechanical work in such a process:
Specific disposable (useful) external work:
From the equation of state for an ideal gas, the following relationship can be obtained for an isobaric process:
Thus, in an isobaric process, the volume of an ideal gas is proportional to absolute temperature. When a gas expands, the temperature rises; when it is compressed, it decreases.
The change in entropy in an isobaric process can be calculated as follows:
ISOTHERMAL GAS PROCESS.
Isothermal process - the process of communication or. heat removal at constant temperature (
t
-
const)
For an isothermal process of an ideal gas, the relationship between the initial and final parameters is determined by the formulas:
At constant temperature, the volume of a gas changes inversely with its pressure.
On the pv-
ideal gas isotherm diagrams are represented by an equilateral hyperbola. The area under the process curve numerically expresses the mechanical work in a given process. 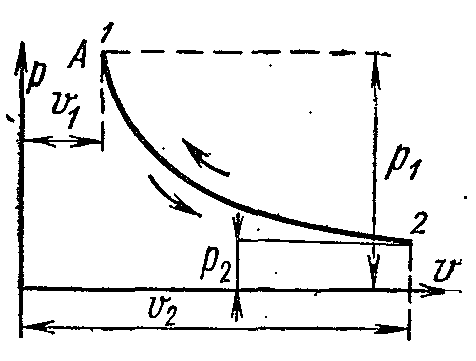
The work of 1 kg of an ideal gas is found from the equations:
Since in an isothermal process t
= const, then for an ideal gas
Entropy change in an isothermal process
Expressed by the following formula:
ADIABATIC GAS PROCESS.
The process proceeding without the supply and removal of heat, i.e. in the absence of heat exchange with the environment, is called adiabatic, and the curve of this process is called adiabatic. Process conditions: dq=0 , q=0.
Because dq=0 , then according to the first law of thermodynamics:
Thus performed by the working body mechanical work in an adiabatic thermodynamic process is equal to a decrease in the internal energy of the body, while the technical work is proportional to the change (decrease) in enthalpy. In a reversible diabatic process, the entropy of a thermodynamic body does not change: S= Const.
Adiabatic equation in coordinate system pv – diagrams at constant heat capacity () for an ideal gas: where is the adiabatic exponent
Dependencies between the initial and final parameters of the process: between R and v ,
between T and v
between R and T
The work of 1 kg of gas is found by the following formulas
The change in the internal energy of the gas and the work of the adiabatic process are equal in magnitude and opposite in sign. .
The change in the internal energy of an ideal gas in an adiabatic process can also be expressed by the equation
Second law of thermodynamics
The second law of thermodynamics establishes the direction of the flow of spontaneous thermal processes in nature and determines the conditions for the transformation of heat into work. The law states that heat in nature spontaneously passes only from bodies that are hotter to less hot.
In accordance with the second law of thermodynamics, in order to convert heat into work in any heat engine, it is necessary to have two bodies with different temperatures. A hotter body will be a heat source for work, a less heated body will be a heat sink. At the same time, the efficiency heat engine will always be less than one.
The second law of dynamics can be mathematically expressed:
Where dS –
an infinitesimal increment of the entropy of the system;
dQ – an infinitesimal amount of heat received by the system from a heat source;
T - absolute temperature of the heat source.
The inequality sign corresponds to irreversible processes, and equals to reversible ones. Therefore, the analytical expression for the second law of thermodynamics for an infinitely small reversible process takes the form
dQ= TdS
and since according to the first law of thermodynamics
dQ=dU+pdV
TdS=dU+pdV.
Carnot cycle and its properties.
Carnot cycle. Consists of two isotherms and two adiabats. This cycle is a closed process performed by the working fluid in an ideal heat engine in the presence of two heat sources: a heater and a refrigerator.

Carnot's cycle pv-diagram
Processes 1-2 and 3-4 are isothermal, while processes 2-3 and 4-1 are adiabatic. The initial temperature of the working fluid in the cycle is taken equal to the temperature heaterT 1 . During isothermal expansion from state 1 to state 2, the working fluid receives from the heater the amount of heatq 1 at a temperatureT 1 . In section 2-3, the working fluid expands adiabatically. At the same time, the temperature of the working fluid decreases fromT 1 before T 2 and the pressure drops from p 2 before p 3 . When compressed along the 3-4 isotherm, the amount of heat is removed from the working fluid to the refrigeratorq 2 at a temperatureT 2 . Further adiabatic contraction4-1 leads to an increase in the temperature of the working fluid fromT 2 before T 1 , and the working fluid returns to its original state.
Total cycle workl c graphically represented by an area of 12341.
Thermal cycle efficiency:
The work of the Carnot cycle
Thermal efficiency cycle:

Cycle characteristics:
Compression ratio
Pressure ratio
Amount of supplied heat:
The amount of heat removed:
Cycle work
Thermal efficiency cycle:
A cycle with heat supply at constant pressure consists of two adiabats, one isobar and one isochore.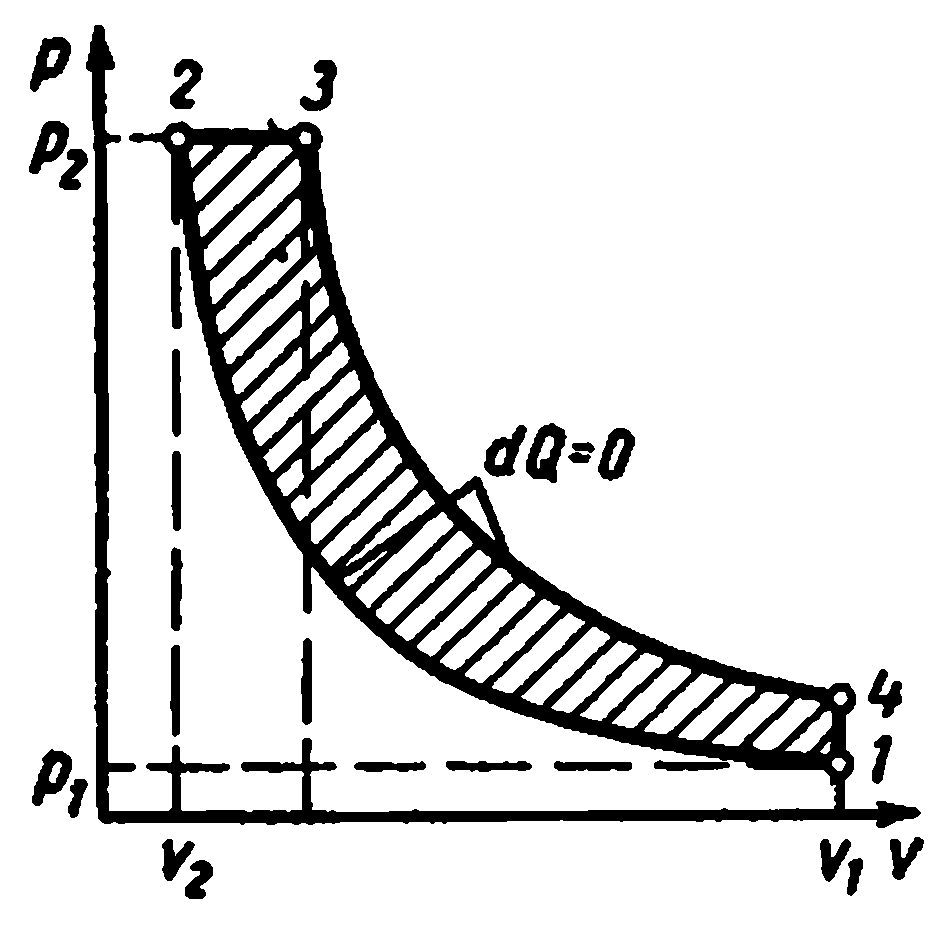
Cycle characteristics:
Compression ratio
Amount of supplied heat:
The amount of heat removed:
Cycle work
Thermal efficiency cycle:
Cycle with combined heat supply consists of two adiabats, two isochores and one isobar

Cycle Characteristics
The amount of heat supplied
The amount of heat removed
Thermal efficiency cycle
Water vapor tables.
superheated steam or saturated steam in their properties differ significantly from ideal gases. The equations for the state of vapors are very complex and are not used in computational practice. For practical purposes, tables and diagrams are used, compiled on the basis of experimental and theoretical data. The tables are compiled with a high degree of accuracy for superheated and saturated vapors up to a temperature of 1000 0 C and a pressure of 98.0 MPa.
In the tables for saturated steam saturation temperatures, pressures, values specific volumes, enthalpy and entropy of liquid and dry steam, heat of vaporization. In the tables of superheated steam, the values of the main parameters are given for various pressures and temperatures: specific volume, enthalpy and entropy.
i – S water vapor diagram.
great dignity is diagram is that the technical work and the amount of heat involved in the processes are represented by line segments, not areas. When building is- charts plotted along the y-axis specific enthalpy pair, and along the abscissa is the specific entropy. The origin of coordinates is taken to be the state of water in triple point, where, .
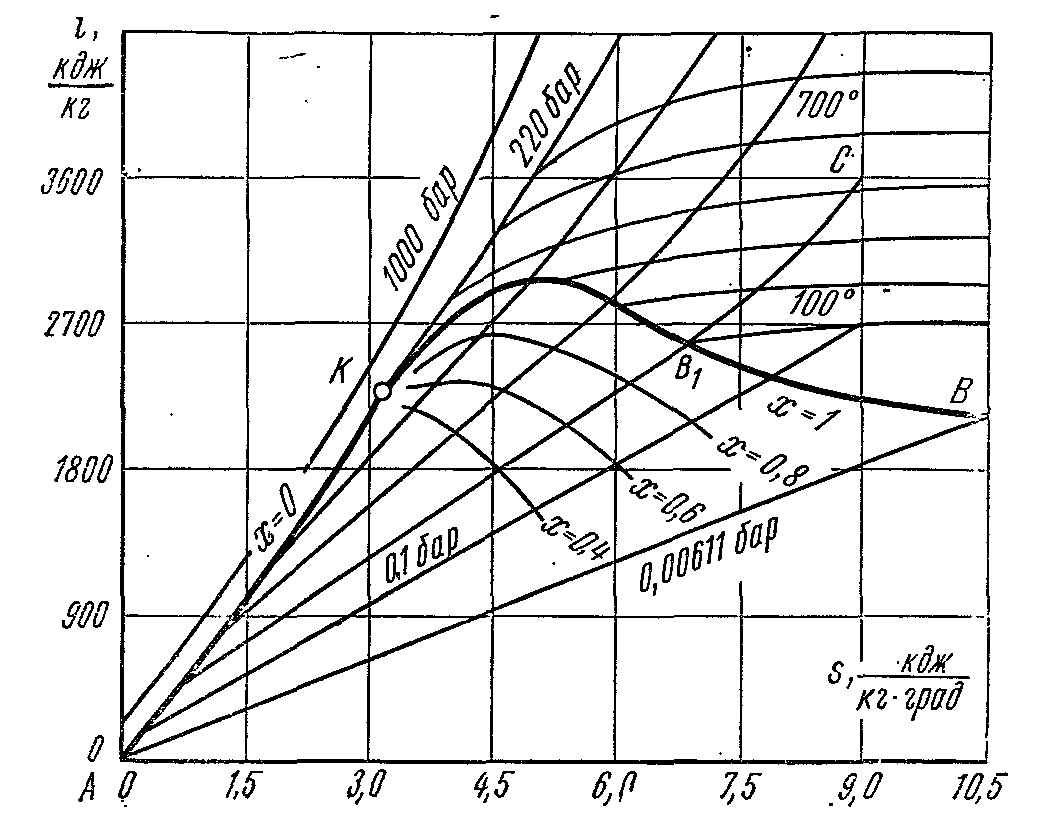
Using the data of the water vapor tables, the boundary curves of liquid and vapor are plotted on the diagram, converging at the critical point K. The boundary curve of the liquid leaves the origin, because at this point, the entropy and enthalpy are taken equal to zero. The state of water is marked with dots on the corresponding isobars. Isobar lines in the area wet steam are straight inclined lines fanning out from the fluid boundary curve. In an isobaric process:
The slope of the isobar to the abscissa at each point of the diagram is numerically equal to the absolute temperature of the given state. Because in the area of wet steam, the isobar coincides with the isotherm, then according to the last equation, the isobar of wet steam are straight lines:
And this is the equation of a straight line. In the region of superheated steam, the isobars have a curvature with a convexity directed downwards. In the area of wet steam, a grid of lines of constant steam dryness (x=const) is applied, which converge at the critical point K.
The isotherms in the wet steam region coincide with the isobars. In the area of superheated steam, they diverge: the isobars rise up, and the isotherms are curved lines with a convexity upwards. A grid of isochores is applied to the diagram, which have the form of curves that rise more steeply compared to isobars. A reversible adiabatic process is represented by a vertical straight line. The area below the isobar of the triple point depicts the states of the mixture of steam + ice.
adiabatic processp – V , i – S andT – S diagrams.
The adiabatic process takes place without the supply and removal of heat, and the entropy of the working fluid in the reversible process remains constant value: s=const. Therefore, on is
and
Ts-
adiabatic diagrams are depicted by vertical straight lines: fig. a and b 

During adiabatic expansion, the pressure and temperature of the vapor decrease; superheated steam turns into dry and then into wet steam. From the conditions of constancy of entropy, it is possible to determine the final parameters of the steam if the parameters of the initial and one parameter of the final states are known.
On the pv- in the diagram, a reversible adiabatic process is depicted by a certain curve (Fig. c)
The specific work in an adiabatic process is determined from the equation:
Change in specific internal energy:
Multi-stage compression in the compressor.
Multi-stage compressors are used to produce high-pressure gas
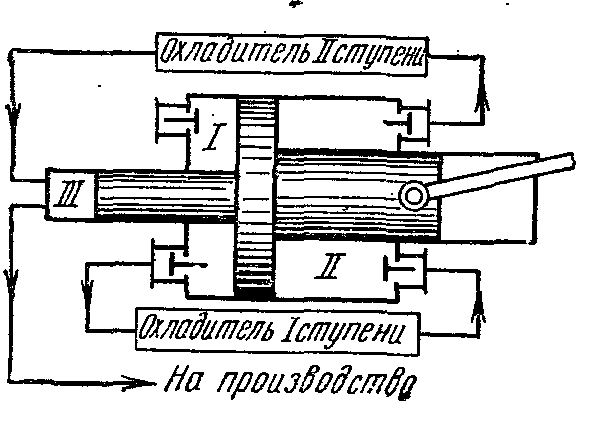
In which gas compression is carried out polytropically in several cylinders connected in series with its intermediate cooling after each compression.
The use of gas compression in several cylinders lowers the pressure ratio in each of them and increases the volumetric efficiency. compressor. In addition, intermediate cooling of the gas after each stage improves the lubrication conditions of the piston in the cylinder and reduces the energy consumption for the compressor drive.

The ideal indicator diagram of a three-stage compressor, where 0-1 is the suction line to the first stage;
1-2 - polytropic compression process in the first stage; 2-a - injection line from the first stage to the first cooler; a-3 - suction line to the second stage; 3-4 - polytropic compression process in the second stage; 4-c - discharge line from the second stage to the second cooler; c-5 - suction line to the third stage; 5-6 - polytropic compression process in the third stage; 6-c - injection line from the third stage to the tank or to production. Segments 2-3, 4-5 depict the decrease in gas volume in the process at constant pressure from cooling in the first and second coolers. Cooling of the working fluid in all coolers is carried out to the same temperature equal to the initial T 1, therefore, the gas temperatures at points 1, 3 and 5 are the same and lie on the isotherm 1 - 7.
The ratio of pressures in all stages is usually taken the same:
With the same pressure ratios in all stages, the equality of the initial temperatures and the equality of the polytropic indicators, the final gas temperatures in the individual compressor stages are equal to each other:
The degree of pressure increase in each stage or at z stages
The degree of pressure increase in each stage is equal to the root z-th degree from final pressure ratios
Back to initial
With equal gas temperatures at the entrance to each stage and equal pressure ratios in all cylinders, we obtain the equality of the work expended in all stages of the compressor:
In the second step
Work in the third stage
Where l 1
=l 2
=l 3
Total specific work in joules spent on gas compression in three compressor stages: l to =3 l 1
Under the same gas compression conditions, the amounts of heat removed from the gas in individual stages are equal to each other:
The heat removed from the gas in any cooler during the isobaric cooling process is found by the formula:

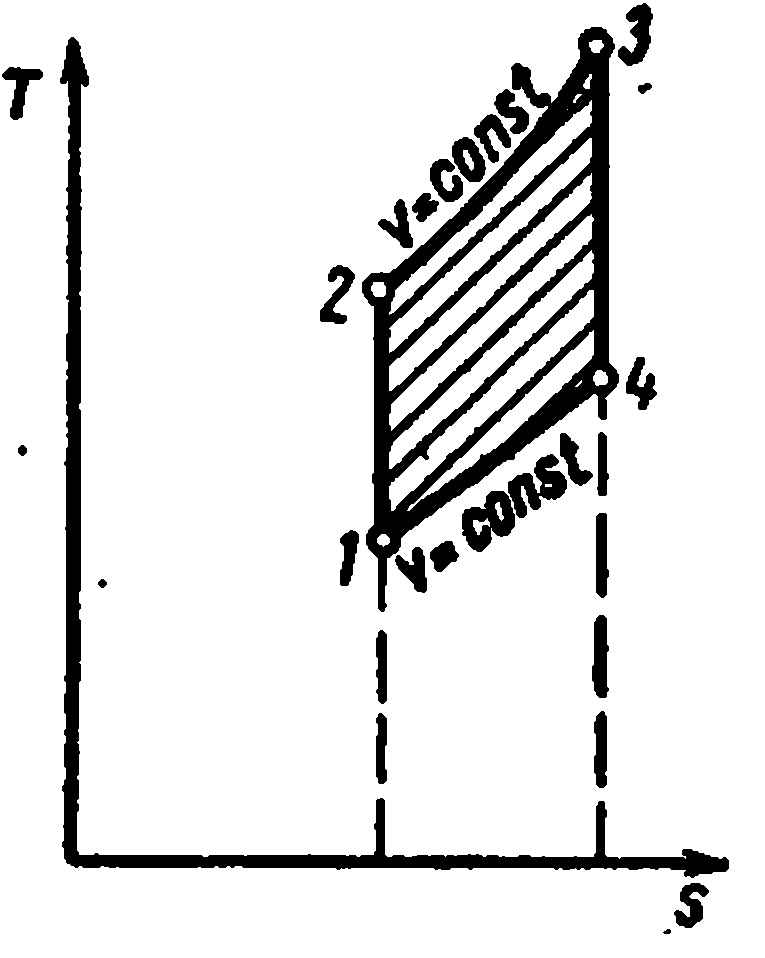
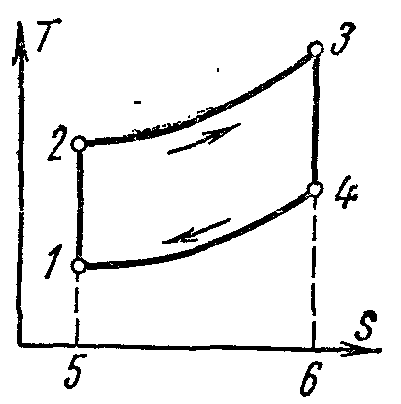
AT Ts- In the diagrams, the processes of adiabatic compression are shown by straight lines 1-2, 3-4, 5-6, and the cooling processes by curves 2-3, 4-5, 6-7.
Polytropic compression processes are shown by curves 1-2, 3-4, 5-6, and cooling processes in coolers - by lines 2-3, 4-5, 6-7.
ICE cycle with combustion atV = const

The figure shows an indicator diagram of an engine operating with fast-burning fuel at a constant volume. As a fuel, gasoline, lighting or generator gas, alcohols, etc. are used.
When the piston moves from the left dead position to the extreme right, the combustible mixture is sucked through the suction valve. This process is depicted by a 0-1 curve, called the suction line, it is not a thermodynamic process, because. in it, the main parameters do not change, but only the mass and volume of the mixture in the cylinder change. When the piston moves back, the suction valve closes, and the combustible mixture is compressed. Depicted by curve 1-2, called the compression line. At point 2, the combustible mixture ignites from an electric spark. The combustion of the combustible mixture occurs almost instantly, i.e. at almost constant volume. This process is depicted by curve 2-3. As a result of fuel combustion, the gas temperature rises sharply and the pressure increases (point 3). Then the combustion products expand. The piston moves to the right dead position, and the gases do useful work. On the indicator diagram, the expansion process is depicted by a 3-4 curve, called the expansion line. At point 4, the exhaust valve opens and the pressure in the cylinder drops to almost outside pressure. With further movement of the piston from right to left, combustion products are removed from the cylinder through the exhaust valve at a pressure slightly exceeding Atmosphere pressure. It is depicted as a 4-0 curve and is called the exhaust line. Such a workflow is completed in four strokes of the piston or in two revolutions of the shaft. Such engines are called four-stroke.
The cycle with heat supply at constant volume consists of two adiabats and two isochores
The characteristics of the cycle are:
- compression ratio
– degree of pressure increase
Amount of supplied heat:
The amount of heat removed:
Cycle work
Thermal efficiency cycle:
ICE cycle with combustion atp = const
The study of cycles with the supply of heat at a constant volume showed that in order to increase the efficiency of an engine operating according to this cycle, it is necessary to use high compression ratios. Air at high compression has such a high temperature that the fuel supplied to the cylinder spontaneously ignites without igniters. Separate compression of air and fuel allows the use of any liquid heavy and cheap fuel - oil, fuel oil, resins, coal oils.
This advantage is possessed by engines operating with gradual combustion of fuel at constant pressure. In them, air is compressed in the engine cylinder, and liquid fuel is sprayed with compressed air from the compressor.
The ideal engine cycle with gradual combustion of fuel at constant pressure, i.e. the cycle with the supply of heat at constant pressure is carried out as follows.

Gaseous working fluid with initial parameters p 1 , v 1 , T 1 shrinks along the adiabatic 1-2; then a certain amount of heat is imparted to the body along the 2-3 isobar q 1 . From point 3, the working body expands along the adiabatic 3-4. According to the 4-1 isochore, the working fluid returns to its original state, while heat is removed to the heat sink q 2 .
Cycle characteristics:
Compression ratio
Degree of pre-expansion.
Amount of supplied heat:
The amount of heat removed:
Cycle work
Thermal efficiency cycle:
ICE cycle with heat supply atV and p = const
In a compressorless high-compression engine with a mixed heat input, liquid fuel is supplied by a fuel pump through a fuel injector to the cylinder head in the form of tiny droplets. Getting into the heated air, the fuel spontaneously ignites and burns during the entire period while the nozzle is open: first at a constant volume, and then at a constant pressure.
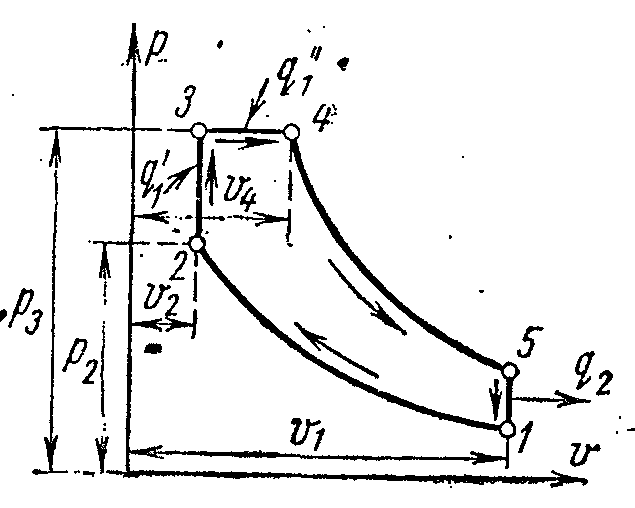

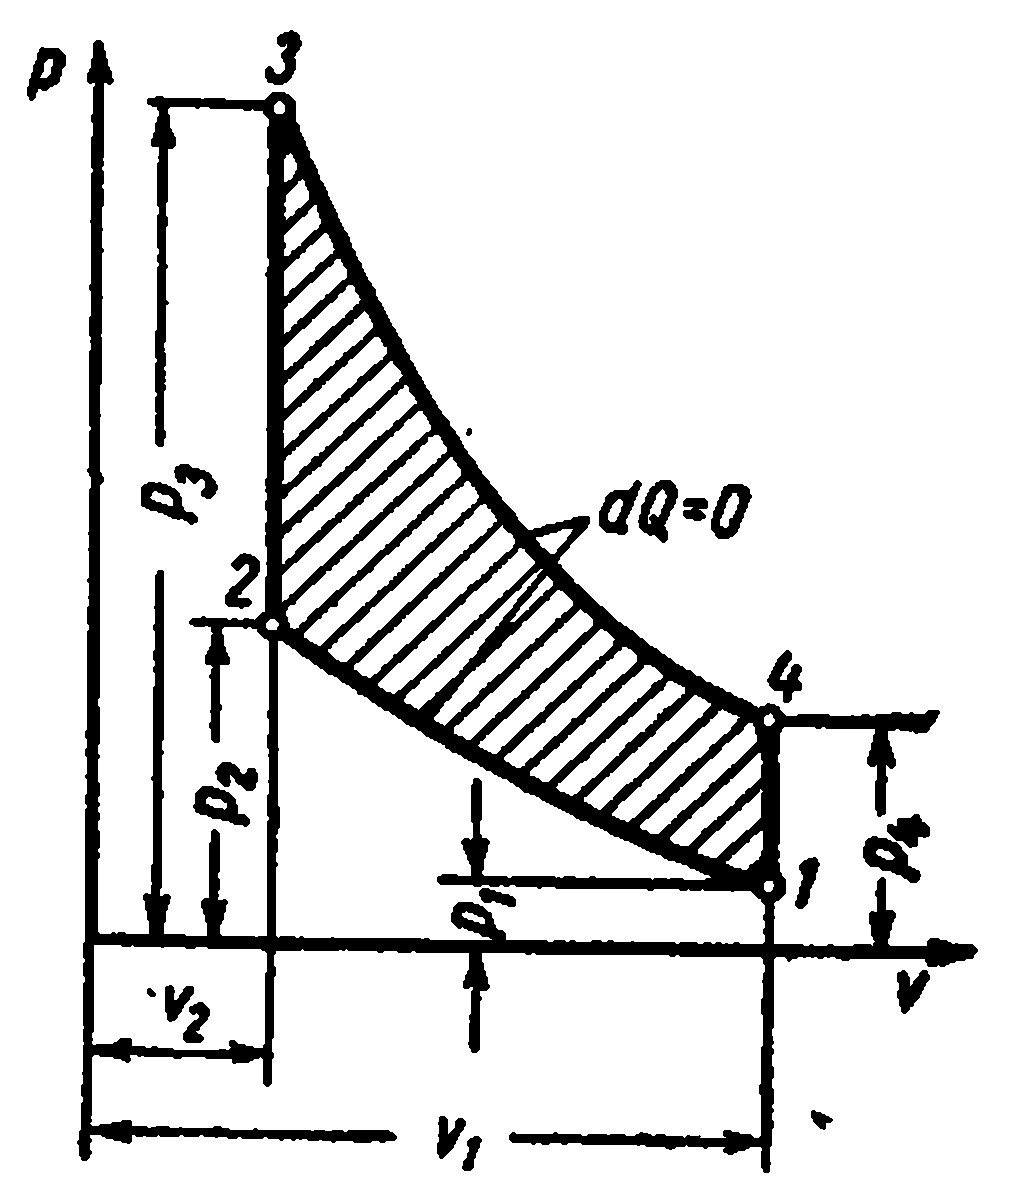
The ideal cycle of an engine with a mixed heat input is shown in pv- andTs- diagrams.
Working body with initial parameters p 1 , v 1 , T 1 is compressed along the adiabatic 1-2 to point 2. The first fraction of heat is supplied to the working fluid along the isochore 2-3. The second part of heat is supplied along isobar 3-4. From point 4, the working body expands along the adiabatic 4-5. Along the isochore 5-1, the working fluid returns to its original state - to point 1, while heat is removed to the heat sink.
The characteristics of the cycle are:
Compression ratio
– degree of pressure increase
Degree of pre-expansion.
Define thermal cycle efficiency provided that the heat capacity c p ,
c v
and adiabatic exponent k=
c p /
c v
constant:
The first share of the supplied heat:
The second part of the supplied amount of heat:
The amount of heat removed:
Thermal cycle efficiency
Cycle of a gas turbine plant
The working fluid in gas turbine plants are products of combustion of liquid or gaseous fuels.

The figure shows a diagram of the most common type of gas turbine plant with fuel combustion at constant pressure.
Compressor K, located on the same shaft with a gas turbine T, sucks air from the atmosphere and compresses it to a given pressure. Compressed air enters the combustion chamber KS; same fuel pump TN liquid fuel is supplied. Combustion takes place at constant pressure. From the combustion chamber gases enter the nozzles FROM, of which they high speed enter the working blades L turbines and set the rotor in rotation. Exhaust gases through the exhaust pipe P released into the atmosphere.
Gas turbine cycle with the supply of heat in the processp
=
const
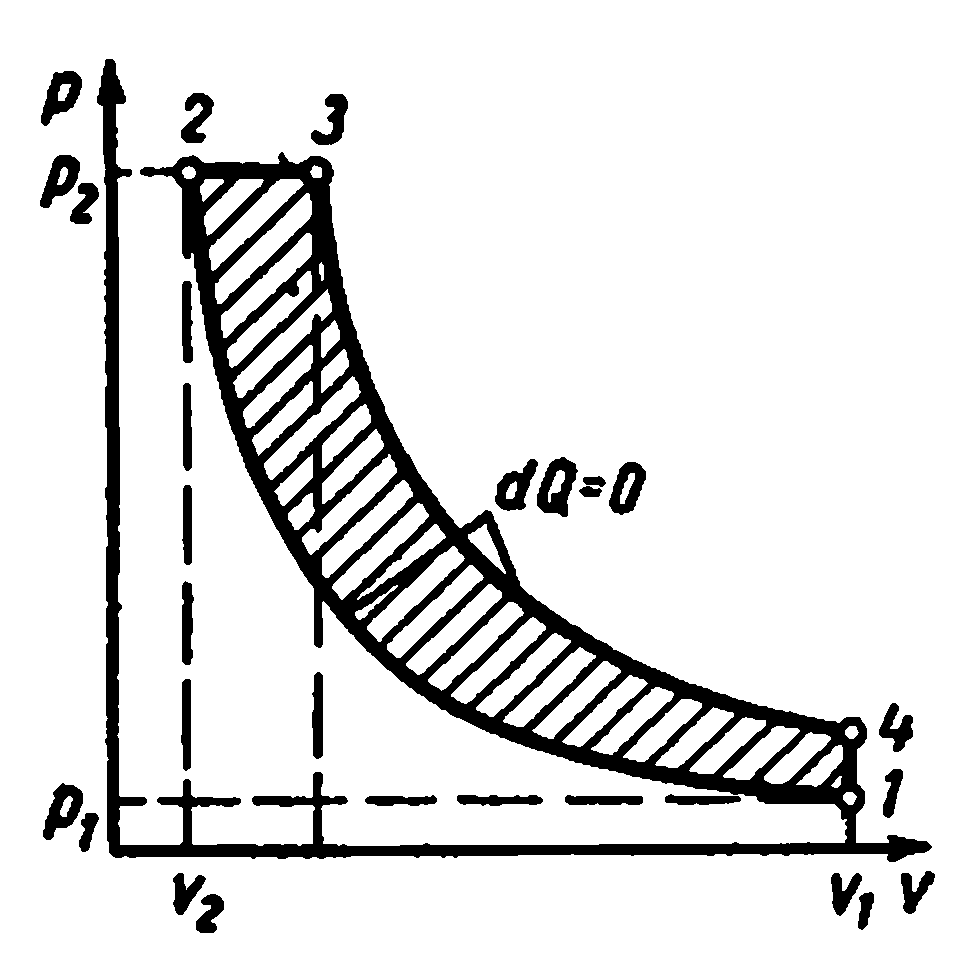
.
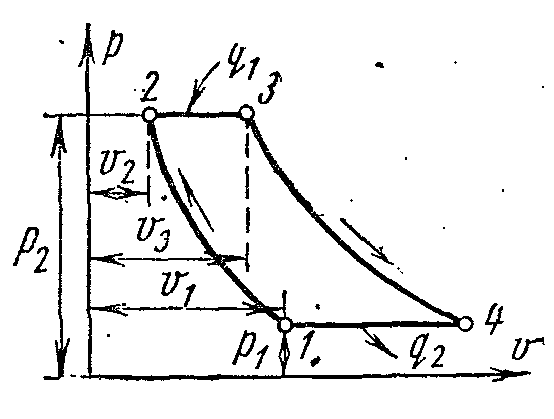
The ideal cycle of a gas turbine plant at pv- andTs- diagrams with heat input at p=
const.
The cycle consists of two adiabats and two isobars.
Heat is removed from the working fluid not along the isochore, as in an internal combustion engine, but along the isobar. Working body with initial parameters p 1 , v 1 , T 1 is compressed along the adiabatic 1-2 to point 2. From point 2, a certain specific amount of heat is supplied to the working fluid q 1 along the isobar 2-3. Then the working fluid expands along the adiabatic 3-4 to the initial pressure and returns along the 4-1 isobar to its original state, while the specific amount of heat is removed q 2 .
The characteristics of the cycle are the degree of pressurization in the compressor and the degree of isobaric expansion.
The amount of heat input:
The amount of heat removed:
Thermal cycle efficiency
Steam power cycle. Rankine cycle.
The ideal Rankine cycle is taken as the main cycle in a steam turbine plant. In this cycle, the working fluid is completely condensed in the condenser, as a result of which, instead of a bulky inefficient compressor, a feed water pump is used to supply water to the boiler, which has small dimensions and high efficiency.
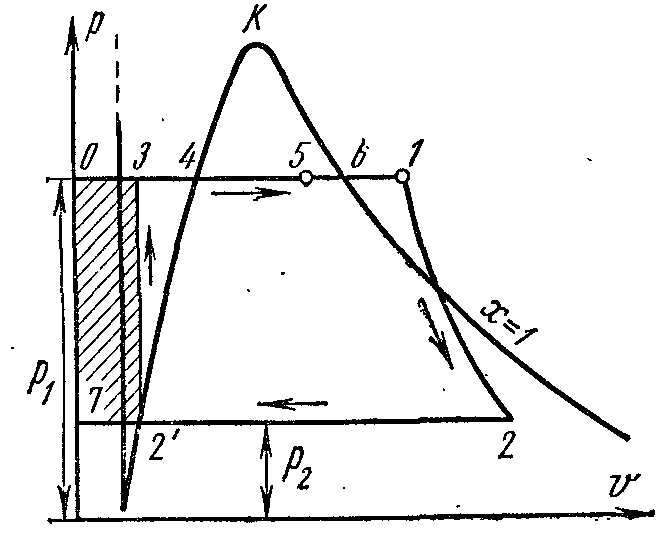
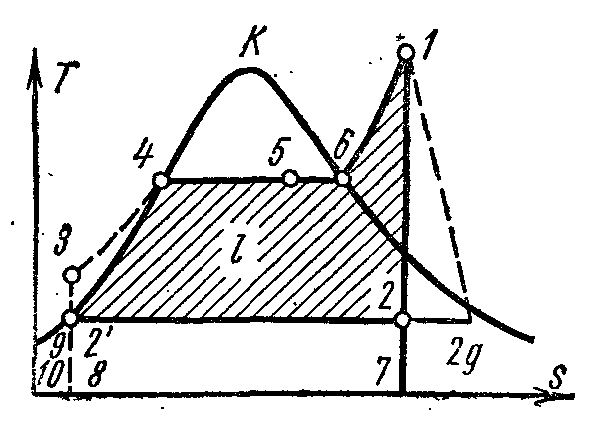
On the pv- point 4 in the diagram characterizes the state of boiling water in the boiler at pressure p 1 . Line 4-5 depicts the process of steam generation in the boiler; then the steam is dried in a superheater at a pressure p 1 . The resulting steam expands along the adiabatic 1-2 in the cylinder of the steam engine to a pressure p 2 in the condenser. In process 2, the steam is completely condensed to the state of a boiling liquid at pressure p 2 by transferring the heat of vaporization to the cooling water. The process of compressing water is carried out in the pump; the resulting increase in water temperature is negligible, and it is neglected in studies at pressures up to 3.0–4.0 MPa. Line 3-4 depicts the change in the volume of water when heated from the temperature in the condenser to the boiling point. The operation of the pump is shown as a shaded square. 03 7. The enthalpy of steam at the outlet of the superheater at point 1 is equal to i 1 and on Ts–diagram depicted pl. 9 34617109. The enthalpy of steam at the entrance to the condenser at point 2 is equal to i 2 and on Ts–diagram depicted pl. 9 . The enthalpy of water when leaving the condenser at a point is equal to i 1 and on Ts–diagram depicted pl. 9 8109. Useful work of steam in the Rankine cycle l depicted on pv- square diagram. .
If the Rankine cycle takes into account the operation of the pump, then the process of adiabatic compression of water in it will be represented by Ts- diagram adiabatic, and isobar 3-4 corresponds to heating water in the boiler at pressure p 1 to the appropriate boiling point.
The thermal efficiency of the Rankine cycle is determined by the formula:
The specific amount of heat in the cycle is supplied at p=
const
in processes 3-4 (heating water to the boiling point), 4-6 (vaporization) and 6-1 (superheating of steam) and is equal to the difference between the enthalpies of the initial and final points of the process:
This specific amount of heat is shown in Ts–diagram sq. eight . Removal of specific amount of heat q 2
is carried out in the condenser along the isobar 2-, therefore
Heat removed depicted on Ts–diagram sq.
Thermal efficiency of the Rankine cycle:
Air Compressor Refrigeration Cycle
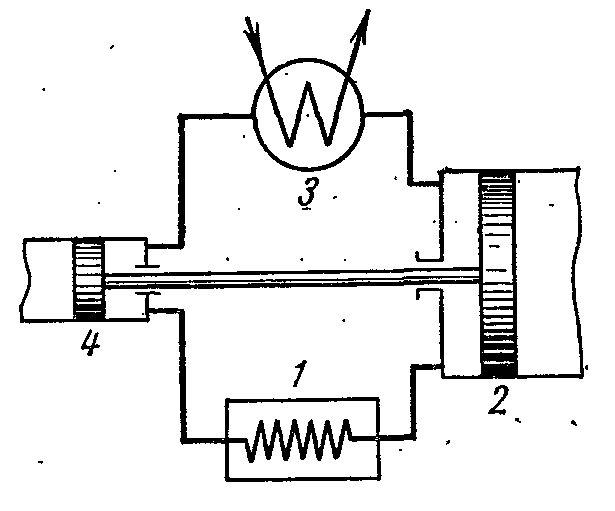
The figure shows a diagram of an air refrigeration plant, where air is used as the working fluid, which is the most convenient, harmless and affordable working fluid. Air refrigeration unit operates as follows.
The air cooling the room 1 is compressed in the compressor 2, as a result of which its temperature increases. Compressed air at a constant pressure is injected into the heat exchanger 3, in which it is cooled with water to the ambient temperature. After that, compressed air enters the expansion cylinder, or expander 4, where it expands to the initial pressure. When expanding, the air temperature drops to -60 or -70 0 C and the refrigeration air is sent to cool the room, where, heated, it again enters the compressor.

AT pv- andTs– diagrams:
Air in process 1-2 is adiabatically compressed by pressure p 1 before p 2 . In the isobaric process 2-3, the specific amount of heat is removed from the air to an external source and its temperature decreases from T 2 to T 3 . With adiabatic expansion in process 3-4, the air is additionally cooled from the temperature T 3 to T 4 . Further, in the 4-1 isobaric process, heat is removed from the cooled room (heat transmitter), as a result of which the air is heated from T 4 to T 1 .
The work expended on the implementation of the cycle is equal to the difference in the specific quantities of heat q 1 and q 2. Assuming the heat capacity to be constant, we have:
Then the refrigeration coefficient of the cycle:
=
From adiabatic processes 1-2 and 3-4
And
But p 2
=
p 3
, a p 1
=
p 4
then
Finally we have
Where T 1
is the temperature of the room to be cooled or the temperature of the air sucked into the compressor.
T 2 is the temperature of the compressed air.
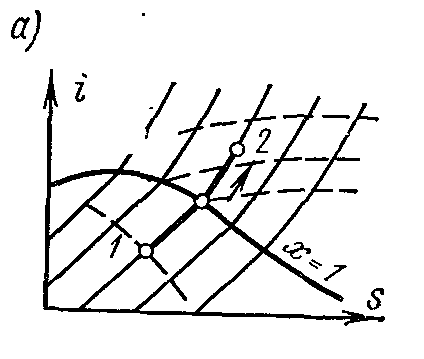
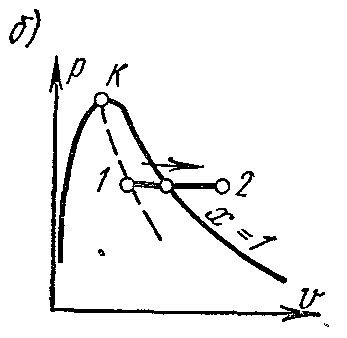
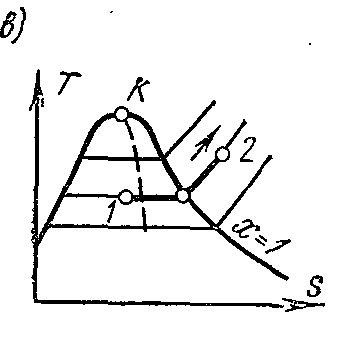
Steam Compressor Refrigeration Cycle
The most widespread for cooling bodies to a temperature of -20 0 C are refrigeration units in which the refrigerant is low-boiling liquids - ammonia, freons, sulfur dioxide and others at low pressures (preferably close to atmospheric).
The figure shows a diagram of a compressor unit operating on ammonia vapor NH 3 .
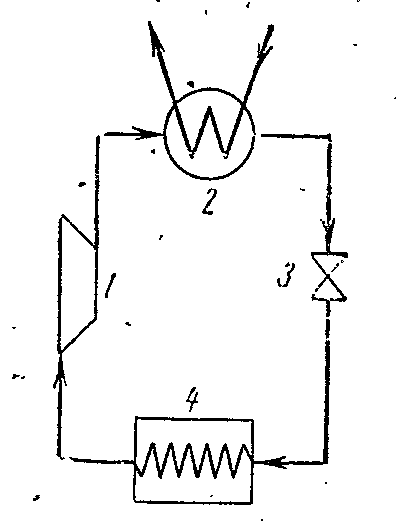

1- compressor; 2- capacitor; 3- throttle valve; 4 - refrigerated room (evaporator)
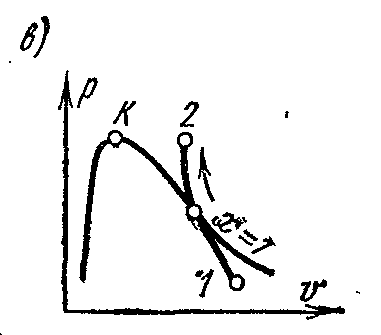
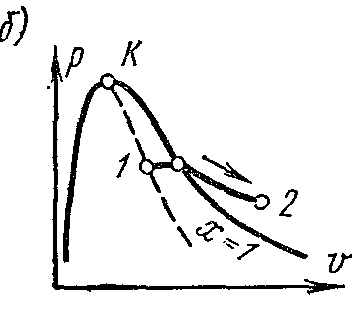
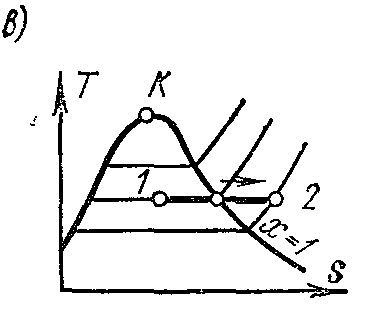
The compressor compresses ammonia dry saturated steam or wet steam with a high degree of dryness along the adiabatic 1-2 to the state of superheated steam at point 2. From the compressor, steam is injected into the condenser, where it completely turns into a liquid (process 2-3-4). From the condenser, liquid ammonia passes through a throttle valve, where it is throttled, which is accompanied by a decrease in temperature and pressure. Then liquid ammonia with low temperature enters the cooler, where, receiving the amount of heat (in process 5-1), it evaporates and cools the brine, which circulates in the cooled chambers. The throttling process as an irreversible process is depicted in the conditional curve diagram 4-5.
In a steam compressor installation, an expansion cylinder (expander) is not used, and the working fluid is throttled in the control valve. Replacing the expansion cylinder with a choke is accompanied by an increase in entropy, which causes some loss in cooling capacity, but this replacement greatly simplifies installation and makes it possible to easily regulate the steam pressure and obtain an irreversible temperature in the cooler.
Specific work spent on the cycle: =
Refrigerating coefficient of ammonia compressor unit:
Where is the specific amount of heat perceived by ammonia vapor in the cooler.
Cooling factor of installation
The enthalpy values in the equation are determined by is-diagram or according to the ammonia table.
Steam refrigeration units have a great advantage over air refrigeration. They are compact, cheap and have a higher COP.
The vaporization process inp – V diagram
Phase pv- chart of a system consisting of liquid and steam is a graph of the dependence of the specific volumes of water and steam on pressure.
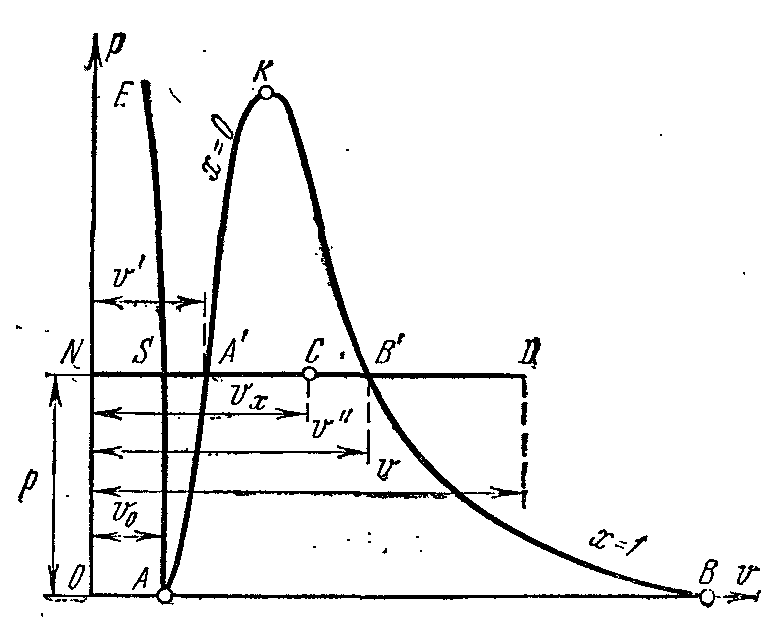
Let the water at a temperature 0 0 FROM and some pressure? occupies a specific volume v 0 (segment NS) . Whole Curve AE expresses the dependence of the specific volume of water on pressure at temperature 0 0 FROM. Because water is a substance almost incompressible then a curve AE nearly parallel to the y-axis. If heat is imparted to water at constant pressure, then its temperature will rise and the specific volume will increase. At some temperature t s water boils, and its specific volume v’ at the point BUT' reaches its maximum value at a given pressure. As the pressure increases, the temperature of the boiling liquid increases. t s and volume v’ also increases. dependency graph v’ AK which is called the fluid boundary curve. The characteristic of the curve is the degree of dryness x=0 . In the case of further heat supply at constant pressure, the process of vaporization will begin. At the same time, the amount of water decreases, the amount of steam increases. At the end of vaporization at the point AT' the steam will be dry and saturated. The specific volume of dry saturated steam is denoted v’’ .
If the process of vaporization proceeds at a constant pressure, then its temperature does not change and the process A’ B’ is both isobaric and isothermal. At points A’ and B’ the substance is in a single-phase state. At intermediate points, the substance consists of a mixture of water and steam. This mixture of bodies is called two-phase system.
Specific volume plot v’’ from pressure is represented by a curve KV, which is called the vapor boundary curve.
If heat is supplied to dry saturated steam at constant pressure, then its temperature and volume will increase and the steam will go from dry saturated to superheated (point D). Both curves AK and HF divide the diagram into three parts. To the left of the fluid boundary curve AK the liquid region is located before the zero isotherm. Between curves AK and HF there is a two-phase system consisting of a mixture of water and dry steam. to the right of HF and up from the point To there is an area of superheated steam or gaseous state body. Both curves AK and HF converge at one point To called the critical point.
The critical point is the end point phase transition liquid - vapor, starting at the triple point. Above critical point the existence of matter in a two-phase state is impossible. No amount of pressure can turn a gas into liquid state at temperatures above critical.
Critical point parameters for water:
t to =374,12 0 FROM;v to =0.003147 m 3 /kg;
? to =22.115 MPa;i to =2095.2 kJ/kg
s to =4.424 kJ/(kg K).
Processp = const water vapor. Process image inp – V , i – S andT – S diagrams.
On the is- chart the isobar in the region of saturated vapor is represented by a straight line crossing the boundary curves of the vapor liquid. When heat is supplied to wet steam, its degree of dryness increases and (at a constant temperature) it passes into dry, and with further heat supply - into superheated steam. The isobar in the region of superheated steam is a curve with a convexity downward.
On the pv- chart the isobaric process is represented by a segment of a horizontal straight line, which in the region of wet steam also depicts an isothermal process at the same time.
On the Ts- chart in the region of wet steam, the isobar is depicted by a straight horizontal line, and in the region of superheated steam, by a curve with a convex point downwards. The values of all the required quantities for the calculation are taken from the tables of saturated and superheated vapors.
Change in the specific internal energy of steam:
External work:
Supplied specific amount of heat:
In that case when q given and it is required to find the parameters of the second point, which lies in the region of two-phase states, the formula for the enthalpy of wet steam is applied:
Process T = const water vapor. Process image inp – V , i – S andT – S diagrams.
isothermal process.

On the is- chart in the region of wet steam, the isotherm coincides with the isobar and is a straight sloping line. In the area of superheated steam, the isotherm is represented by a curve with a convexity upwards.
On the pv- chart in the region of wet steam, the isothermal process is represented by a horizontal straight line. For saturated steam, this process coincides with the isobaric one. In the overheating region, the vapor pressure decreases, and the process is depicted by a curve with a convexity to the abscissa axis.
On the Ts- chart isothermal process is represented by a horizontal segment.
The specific internal energy of water vapor, in contrast to the internal energy of an ideal gas, changes as a result of a change in the potential component, therefore, when T=
const
The summed specific amount of heat in the process:
External work is determined from the first law of thermodynamics:
Mayer formula.
Of particular importance in thermodynamics are the heat capacities of a gas at constant pressure, i.e. in an isobaric process - and at a constant volume, i.e. in an isochoric process. These heat capacities are related by the Mayer formula
Heat capacity ratio
Where k is the adiabatic index.
The concept of "Cooling coefficient"
COP dimensionless quantity (usually more than one), characterizing the energy efficiency of workrefrigeration machine; is equal to the ratiocooling capacityto the amount of energy (work) expended per unit of time on the implementation refrigeration cycle. It is determined by the type of refrigeration cycle in which the machine operates, by the perfection of its main elements, and for the same machine it depends on the temperature conditions of its operation.
The coefficient of performance of an ideal refrigerating machine operating on the reverse Carnot cycle:
where T min and T Max are, respectively, lower and higher temperature in a cycle.
The coefficient of performance of an air chiller (figure),
where T 1 and T 2 are the temperatures of the beginning and end of adiabatic compression, respectively;
T 3
and T 4
are the temperatures of the beginning and end of the adiabatic expansion in the expander.
p n and T n)
according to the formula
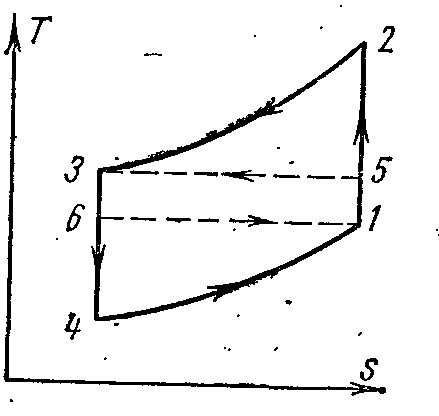
Cycle of a gas turbine plant with regeneration
Thermal efficiency of gas turbines with fuel combustion at p= const increases with increasing pressure. However, with growth, the temperature of gases at the end of fuel combustion also increases. T 3 as a result, turbine blades and nozzles are rapidly destroyed, the cooling of which is difficult. To increase the efficiency of gas turbines, they partially changed their working conditions. The installations began to use heat recovery, multi-stage air compression in the compressor, multi-stage combustion, etc. This gave a significant effect and increased the degree of perfection of the conversion of work into heat in the installations.
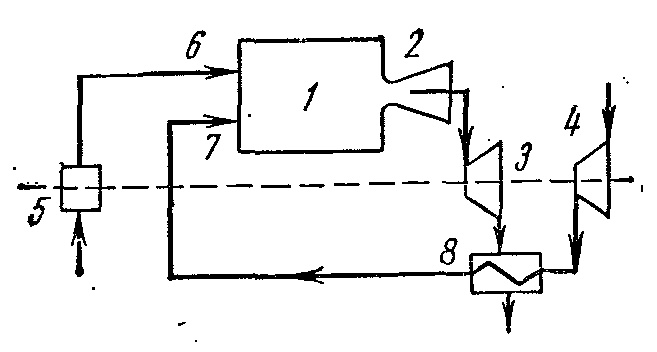
The compressed air from the turbocharger 4 is sent to the regenerator 8 where it receives heat at a constant pressure from the gases exiting the combustion chamber 1 through the nozzle 2 into the turbine 3. The heated air from the regenerator 8 through the nozzle 7, and the fuel from the fuel pump 5 through the nozzle 6 is sent to the chamber combustion 1.
The ideal cycle of such an installation in the diagrams:

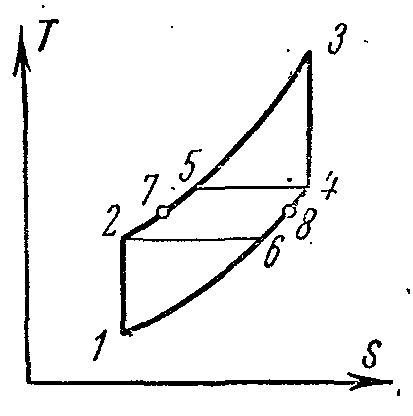
1-2 adiabatic compression of air in the compressor;
2-5 isobaric heat supply in the regenerator;
5-3 heat supply at constant pressure in the combustion chamber;
3-4 adiabatic expansion of combustion products in the turbine nozzles;
4-6 isobaric heat removal from gases in the regenerator;
6-1 isobaric heat removal from gases at the outlet of the regenerator to the heat sink.
If we assume that the cooling of gases in the regenerator occurs to the temperature of the air entering it, i.e. from T 4 to T 6 =T 2 the regeneration is complete.
The thermal efficiency of the cycle at full regeneration when T 4
-T 6
=T 5
-T 2
located:
where
Temperatures at the main points of the cycle:
cycle efficiency
Specific consumption of steam and heat in steam power plants
When calculating steam turbine plants and individual elements in it, it is required to know the specific steam consumption, denoted d.
Theoretical specific consumption of steam and heat in kilograms per 1 MJ:
Where i 1
and i 2
–enthalpy, kJ/kg.
Theoretical specific consumption of steam and heat in kilograms per 1 kWh:
Steam reheat
A study of the operation of a steam turbine plant shows that an increase in the initial pressure and a decrease in the final pressure leads to an increase in the efficiency of the cycle. However, one increase in the initial pressure increases the final moisture content of the steam. To reduce the humidity of the steam at the end of the expansion increase starting temperature his. One of the ways to increase the degree of steam dryness at the outlet of the turbine is its secondary overheating. Superheated steam from the boiler with initial pressure and temperature enters the first turbine cylinder, consisting of several stages, where it expands adiabatically to a certain pressure p 1 . The resulting steam is removed to a special superheater, where it is subjected to secondary overheating at constant pressure. It is then returned to the turbine again, where the steam continues to expand to condenser pressure.

Point 1 corresponds to the initial state of the steam; point 2 - the final state of the steam after the turbine after the secondary overheating. The final degree of dryness as a result of the introduction of reheat increases from x 2 before x 1 . In addition, secondary superheating of steam gives some economic effect (2-3%) if the average temperature of heat supply in the additional cycle 7-2-2 ’-6-7 is higher average temperature heat supply in a cycle with a single superheat, and the effect will be greater, the higher the temperature at the initial and final points of intermediate superheat. At pressures close to critical and supercritical, two or more intermediate overheatings are sometimes used. Then the thermal efficiency of the cycle
Where is the adiabatic heat drop in the first and second turbine cylinders;
- the amount of heat supplied to the boiler and the first superheater;
The amount of heat supplied to the second superheater.
Specific steam consumption


