Water vapor superheated saturated wet. Liquid and steam state parameters
Figure 11 - TS- water vapor diagram
Graphically on TS- diagram, an arbitrary process of heating a liquid, vaporization and superheating of steam at constant pressure represented by a curve  . If we put a number of such isobaric processes on the diagram and connect the characteristic points, we get the boundary curves of the boiling liquid AK
(x=0) and dry steam HF
(x=1) that converge in critical point
To.
. If we put a number of such isobaric processes on the diagram and connect the characteristic points, we get the boundary curves of the boiling liquid AK
(x=0) and dry steam HF
(x=1) that converge in critical point
To.
The boundary curves divide the diagram into three parts: to the left of AK is the area of the liquid, between the curves AK and HF is the area of wet steam, to the right of KB and up from the point To– region superheated steam.
Isobars are applied to the diagram, lines of constant specific volumes, and in the area of wet steam - lines of equal degrees of dryness. The area of the diagram below the isobar triple point ( ), depicts the various states of a mixture of steam + ice.
On the TS- diagram, the area enclosed between the line of the reversible process and the abscissa axis (for example,  ), depicts the specific amount of heat imparted to the working fluid to convert water into superheated steam. The specific work of any reversible cycle is depicted on TS-diagram of cycle area. By using TS-diagrams easy to determine the thermal efficiency of a reversible cycle.
The disadvantage of the diagram is that when determining the amount of heat, it is necessary to measure the corresponding areas, which complicates the determination of the required values.
35Is-water vapor diagram

Figure 12 - IS- water vapor diagram
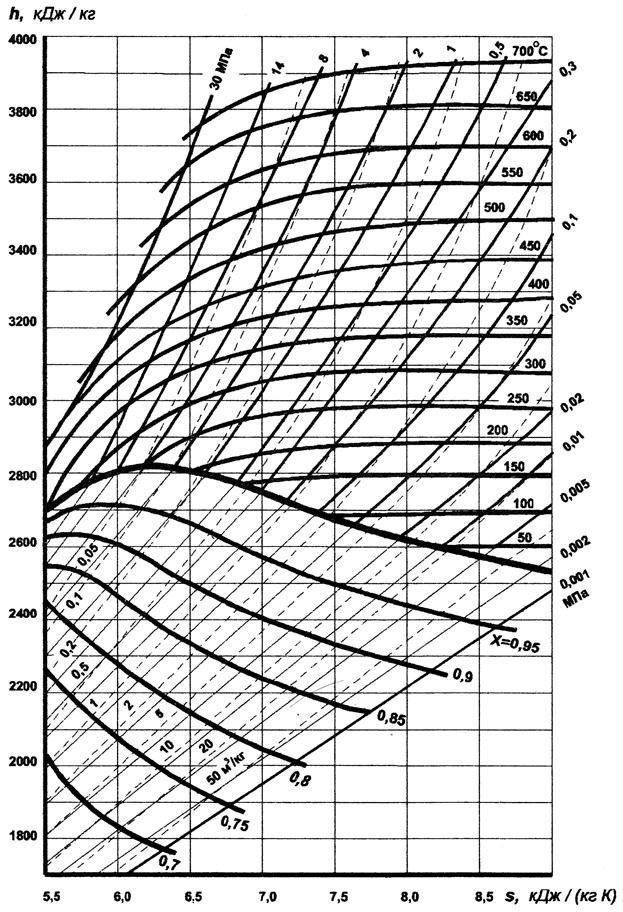
IS-diagram for water vapor was first proposed by Mollier in 1904 and has certain advantages in calculations compared to TS-diagram.
great dignity IS-diagrams is that the technical work and the amount of heat involved in the processes are represented by line segments, and not by areas, as in TS-diagram.
The specific enthalpy of steam is plotted along the ordinate axis, and the specific entropy is plotted along the abscissa axis. The origin of coordinates is taken to be the state of water at the triple point, where the entropy and enthalpy of water are equal to zero.
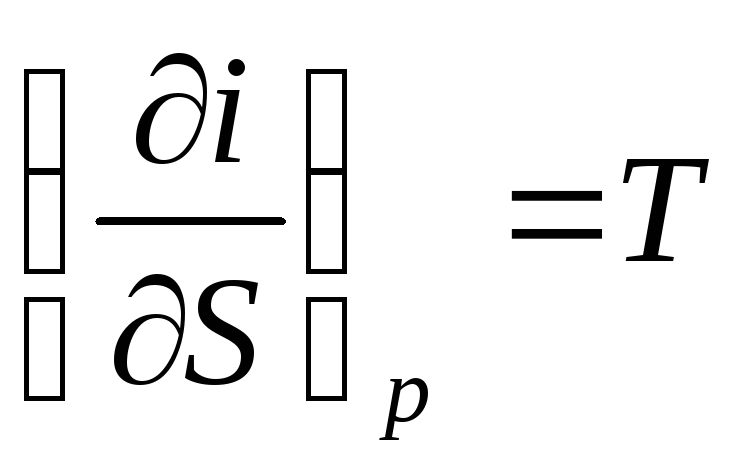
Using the data of the tables of water vapor, on the diagram, first of all, the boundary curves of the liquid and vapor are plotted, converging at the critical point To. The boundary curve of the liquid leaves the origin, since at this point the enthalpy and entropy are assumed to be zero. The state of water is represented by points on the corresponding isobars, which practically merge with the boundary curve of the liquid. The isobar lines in the region of wet steam are straight inclined lines fanning out from the boundary curve of the liquid. In an isobaric process:
 (115)
(115)
 . (116)
The slope of the isobar to the x-axis at each point of the diagram is numerically equal to absolute temperature this state. Since in the region of wet steam the isobar coincides with the isotherm, according to the last equation, the isobar of wet steam are straight lines:  , and this is the equation of a straight line.
In the region of superheated vapor, the isobars have a curvature with a convexity directed downwards. Isobar AB corresponds to the pressure at the triple point.
In the area of wet steam, a grid of lines of constant steam dryness (  ) that converge at the critical point To. The isotherms in the wet steam region coincide with the isobars. In the area of superheated steam, they diverge: the isobars rise up, and the isotherms are curved lines with a convexity upwards. At low pressures the isotherms are very close to horizontal straight lines; with increasing pressure, the curvature of the isotherms increases. A grid of isochores is applied to the diagram, which have the form of curves that rise more steeply compared to isobars.
Reversible adiabatic process in IS-diagram is represented by a vertical straight line. Therefore, all vertical lines are adiabats. The region of the diagram below the isobar of the triple point depicts the various states of the vapor+ice mixture.
wet condition saturated steam determined by its pressure or temperature and the degree of dryness x. Obviously, the value x = 0 corresponds to water in the boiling state, and x = 1 to dry saturated steam.
The temperature of wet steam is a function of pressure only and is determined in the same way as the temperature of dry steam, according to tabular values. The specific volume of wet steam depends on the pressure and on the degree of dryness and is determined from the equation:
From this formula we get the value:
For pressures up to 3 MPa and x ≥ 0.8, the last term of the equation can be neglected. Then the specific volume of wet saturated steam:
v x \u003d v "x.(13.3)
For high pressures and small, the full formula should be used.
Wet steam density:
![]() (13.4)
(13.4)
or approximately
 . (13.5)
Rice. 13.3 - hs - diagram of the vaporization process
Superheated steam has more high temperature compared with the temperature U of dry saturated steam of the same pressure. Therefore, in contrast to saturated steam, superheated steam of a certain pressure can have various temperatures. To characterize the state of superheated steam, it is necessary to know two of its parameters, for example, pressure and temperature. The temperature difference between superheated and saturated steam of the same pressure t - t n is called steam overheating.
It is very important in thermotechnical calculations to determine the amount of heat spent on individual stages of the process of vaporization and changes in internal energy.
The amount of heat expended to heat the liquid from 0 ° C to the boiling point at constant pressure is called the heat of the liquid. It can be defined as the difference between the enthalpies of a liquid in a state of boiling and a liquid at the same pressure and 0 ° C, i.e.
![]() , (13.6)
, (13.6)
and since at low pressures it can be considered equal to zero with sufficient accuracy for technical calculations, then
The values of the internal energy of the liquid can be calculated from the general dependence h = u + pv.
u"=h"-pv", (13.8)
and since the value of pv "is small, then at low pressures we can take
u"=h", (13.9)
those. internal energy liquid is equal to the enthalpy of the liquid. The values for h" and hence also u" are given in the saturated steam tables.
The amount of heat required to convert 1 kg of boiling liquid into dry saturated steam at constant pressure is called the heat of vaporization and is denoted by the letter r. This amount of heat is spent on changing the internal energy associated with overcoming the cohesive forces d between the molecules of the liquid, and on the work of expansion (φ).
The value of d is called the internal heat of vaporization, and the value of f is the external heat of vaporization. Obviously,
f = p (13.10)
and r = d + f. (13.11)
The g values are given in the tables for dry saturated steam. Enthalpy h "of dry saturated steam is determined by the formula
and the change in internal energy upon receipt of dry saturated steam from 1 kg of liquid at 0 ° C is from the expression:
u"=h"-pv". (13.13)
For wet saturated steam, we have the following relations:
![]() , (13.15)
, (13.15)
where h x is the enthalpy of wet saturated steam;
u x is the internal energy of wet saturated steam. The amount of heat required to transfer 1 kg of dry saturated steam to superheated at constant pressure is called the heat of superheat. Obviously,
 , (13.16)
where is the true mass heat capacity of superheated steam at constant pressure.
As a result of careful research, it was found that the heat capacities cp superheated vapors depend on temperature and pressure.
However, this dependence is inconvenient to use. Calculations are greatly simplified by the fact that in the tables of water vapor the values of the enthalpy of superheated steam h(i) are given. Therefore, the heat of overheating can be found from the expression:
The entropy of water vapor is measured from conditional zero, which is taken as the entropy of water at 0.01 0 C and at a saturation pressure corresponding to this temperature, i.e. at a pressure of 611 Pa.
The entropies s" and s" are given in the tables of saturated steam, and r / T n can be obtained from the same tables as the difference s"–s".
The entropy of superheated steam can be found from the equation
The values of s are given in the superheated steam table.
), showing the nature of the change in various properties, depending on parameters states. Basically, h, s-diagrams of water and water vapor have received great use, since as working body in heat engineering most often it is water and steam that are used, because of their comparative cheapness and availability, and the most attention is paid to precisely that part of the diagram in which water is in vapor state, because in liquid state it is practically incompressible.
Creation
When conducting technical and economic calculations for the selection equipment in heat power industry and other industries, and modeling of thermal processes, reliable verified data on the thermophysical properties of water and steam in a wide range are needed. pressure and temperatures.
Long-term international cooperation in the field of studying the properties of water and water vapor has made it possible to develop and implement international normative materials containing equations for describing various properties in special tables. Based on these equations, corresponding to the requirements international system equations for scientific and general use (The IFC Formulation for Scientific and Generale Use), detailed tables of the thermophysical properties of water and steam were compiled and published, which are widely used in the practice of engineering thermal calculations. The data obtained by calculation according to international equations were accepted in USSR, and obtained the definition of tables of thermodynamic properties of water and steam. They also included dynamic viscosity data.
Wikimedia Foundation. 2010 .
See what "H, s-diagram" is in other dictionaries:
First-order Butterworth filter LAFC Logarithmic amplitude-phase frequency response (LAFC) represents the frequency response of a linear stationary system on a logarithmic scale. LAFCH is built in the form of two graphs: ... ... Wikipedia
Equilibrium diagram, phase diagram, graphic. the image of equilibrium states (see. Thermodynamic equilibrium) in va in the form of points in n dimensional space, along the coordinate axes to which n independent state parameters of the considered ... ... Big encyclopedic polytechnic dictionary
Star Observational data (Epoch J2000.0) Right ascension ... Wikipedia


