Raman scattering of light
Raman scattering of light (Raman scattering)
1.1.1 Introduction
Scattering of light is a phenomenon in which the interaction of a medium with a light beam leads to the appearance electromagnetic radiation of the same or another spectral composition in directions different from the original. This definition is also suitable for photoluminescence, but photoluminescence is usually associated with the absorption of an incident light quantum and the subsequent emission of another light quantum corresponding to an optical transition between the real electronic levels of the system. Scattering also takes place in the case when a light quantum enters the region of optical transparency of the medium and cannot transfer the system to a higher real level. Spectral scattering is “tied” to the exciting line, while luminescence, as already mentioned, is determined by the eigenenergy levels of the system.
The scattering of an electromagnetic wave without changing its frequency was studied by R. Rayleigh, and is called Rayleigh. We emphasize that the scattering, which we will discuss below, is not scattering in a turbid medium with macroscopic inhomogeneities (such inhomogeneities appear, for example, in a gas, liquid, and solid at critical temperatures; in this situation, intense scattering is observed - the so-called critical opalescence). Rayleigh believed that the mere fact of the existence of the molecular structure of a gas is already sufficient to explain the scattering of light. Later it was shown that a necessary condition for Rayleigh scattering is the presence in the medium of statistical density fluctuations in volumes that are not very small compared to the wavelength of light.
Further studies have shown that the scattered light spectrum contains, in addition to spectral lines characterizing the light incident on the medium, additional lines symmetrically located on the low-frequency and high-frequency sides near the spectral lines of the primary light (Fig. 1) [Stokes (S) and anti-Stokes (AS) scattering components]. The systems of these additional lines are different for various substances, and thus the frequency differences of the primary light wave and additional lines characterize the frequencies of natural resonances of the medium. This phenomenon, discovered in 1928 by V. Raman and K. Krishnan in India and by L.I. Mandelstam and G.S. Landsberg in the Soviet Union, is called Raman or Raman scattering of light (RSS). CRS is observed in various environments- gases, liquids, crystals. The reason for the change in the scattering frequency is a combined process, as a result of which, under the action of an incident light quantum, another light quantum appears and, at the same time, a certain portion of energy is absorbed or released in the medium. Generally speaking, this energy can be associated with various processes - the periodic movement of atoms in a molecule or crystal around the equilibrium position, the transitions of electrons from one level to another, the so-called spin waves in
magnetically ordered media, plasma oscillations in solids etc. However, KRS is usually understood as the appearance of additional combinational lines corresponding to changes in the rotational and oscillatory motion atoms in a molecule or in a crystal lattice (further we will restrict ourselves to consideration of vibrational motion).
1.1.2. Classical consideration of RRS
If an electromagnetic wave with frequency ν 0 and electric vector Е = E 0 cos 2πν 0 t falls on the medium,
then under the action of this wave a dipole moment is induced in the system
p \u003d α E \u003d α E 0 cos2 πν 0 t, |
where α is the polarizability tensor of the system. It is important that the polarizability of a molecule (crystal) periodically changes in time with the frequencies of natural vibrations of the molecule (crystal), since the polarizability at a certain moment of time depends on the arrangement of atoms relative to each other corresponding to this moment. Thus, the polarizability is a function of the coordinates of the atoms of the molecule (crystal), which periodically change with the frequencies of natural oscillations of the system
Ωk :
α (qk )=α 0 +Σ k (dα /dqk )0 q0 k cosΩ k t + | |
1/2Σ km (d2 α / dqk dqm )0 q0 k q0 m cosΩ k t cosΩ m t + ..., |
where q k = q 0 k cos Ω k t are displacements of atoms from the equilibrium position.
If we substitute the expansion (2) of the polarizability α in terms of natural vibrations of the system into expression (1), then it is easy to verify the specific frequency characteristics of the induced dipole moment of the system. This induced dipole moment should be considered as a source of secondary electromagnetic radiation that forms the scattering spectrum. The first term (2) gives the change in time with frequency ν 0 (Rayleigh scattering), the second - with frequencies (ν 0 + Ω k ) and (ν 0 - Ω k ) , the third - with frequencies like (ν 0 + Ω k + Ω m ), (ν 0 – Ω k + Ω m ), etc. . The second and third terms of expansion (2) correspond to the spectra Raman scattering first and second orders. The intensity of the second-order spectra is very low, and in what follows we will consider only first-order Raman.
1.1.3. Quantum mechanical consideration
The mechanism for the appearance of lines with frequencies (ν + Ω to ) and (ν 0 – Ω to ) is schematically shown in Fig. 2 (for simplicity, we will assume that there is one vibrational frequency Ω 0 in the medium). We consider the case of nonresonant scattering, when the frequency of the exciting light ν 0 falls into the region
transparency of the environment. For this reason, the level i , corresponding to the intermediate state of the system, is virtual - its introduction reflects the fact of the interaction of light with the medium, otherwise there would be no scattering. We note that the energy position of the level i is determined by the energy of the quanta of the light beam that excites the scattering. Levels l and r are the initial and final vibrational states of the lower electronic state of the medium - these are the energy levels of the quantum oscillator, which for the n - level is determined by the expression
En = hΩ 0 (n+ 1/ 2 ). |
Depending on which level is l or r higher, the scattering component is Stokes or anti-Stokes. The virtual level i is not a stationary state of the system, and the corresponding wave function Ψ i depends on time. The function Ψ i can be constructed as a linear combination of the wave functions of the real stationary states of the system with time-dependent coefficients. The contribution of a specific real level to this linear combination depends on the energy distance between the virtual level and this real level (if level i coincides with the real energy level of the system, then light is absorbed). Levels l and r are always real states of the lower electronic state, and therefore they correspond to stationary wave functions Ψ 0 l and Ψ 0 r .
We will not present rather cumbersome quantum-mechanical expressions that describe the RRS efficiency. We only point out that they are constructed as products of two matrix elements describing optical transitions from the initial state l to the intermediate virtual state i and from the virtual state i to the final state r.
1.1.4. Selection rules for vibration types of a molecule (crystal).
It can be seen from formula (2) that the contributionb of vibration) q k to the modulation of polarizability by this vibration depends on the value of the derivative (d α /dq k )0 at the equilibrium position of the molecule. It ultimately determines the intensity of a pair of Raman components with frequencies (ν 0 + Ω k ) and (ν 0 –- Ω k ) . Vibrations to which the relative motions of atoms correspond, which do not change the polarizability of the system, are inactive in the RS. Thus, the criterion for the activity of oscillation q k in the Raman spectra is the condition (d α /dq k ) 0 ≠ 0 . Group-theoretic analysis can be used to show that for molecules and crystals whose symmetry group includes an inversion center, there is a rule according to which the same types of vibrations cannot be simultaneously active both in Raman and in light absorption. Here, the absorption of light is understood as the absorption of a light quantum with energy h ν 0 = h Ω 0 and the birth of a vibrational quantum with the same energy [see. expression (3)]. Consider a specific example - the acetylene molecule С–Н = C–H. If a molecule consists of a number S of atoms, then it has 3s degrees of freedom. Of these, (3s–6) determine the positions of atoms in a molecule relative to each other, and
the remaining 6 degrees of freedom describe the position and orientation of the molecule in space. Since the acetylene molecule is linear, these numbers are equal to (3s–5) and 5, respectively. So, the acetylene molecule has 7 types of vibrations, of which two, corresponding to the movements of atoms perpendicular to the axis of the molecule, are doubly degenerate. The types of vibrations of the acetylene molecule and their corresponding frequencies are shown schematically below.
H C C H ω 1 = 1960 cm–1
H C C H ω 2 = 2277 cm–1
H C C H ω 3 = 3320 cm–1
H C C H ω 4 = 1328 cm–1 (doubly degenerate)
H C C H ω 5 = 729 cm–1 (doubly degenerate)
Of these vibrations, the first and third change the polarizability of the molecule and are active in Raman scattering. The remaining oscillations change the dipole moment of the system, i.e. can be excited by an electromagnetic wave and are thus active in absorption.
1.1.5 Ratio of the intensities of the S- and AS scattering components
In scattering theory, it was shown that the intensity of scattering increases in proportion to the 4th power of the frequency of light. This gives the intensity ratio between the anti-Stokes AS and Stokes S components proportional to [(ν 0 – Ω k )/ (ν 0 + Ω k )4 (usually ν 0 >> Ω k ). Next, we consider the temperature dependence of the intensity ratio of the I AS and I S components. A molecule contributes to the AS, the scattering component, when it is in an excited state. The number of molecules in a state with energy E,
NE = N0 exp (– E/ kb T) ,
where N 0 - total number molecules in the system, k b is the Boltzmann constant, T is the temperature. If the energy E 0 corresponds to the ground state, and the excited state E 1, then
IAS / IS = [(ν 0 –Ω k ) /(ν 0 –Ω k )]4 exp[–- (E1 – E0 )/kb T] .
In accordance with relation (3), for the initial and final vibrational states with n = 1, we obtain
IAS /IS = [(ν 0 –Ω k ) /(ν 0 +Ω k ) ]4 exp (– hΩ k / kb T) .
The temperature asymptotics of the intensity of the Raman components is as follows. At high temperature the exponent is close to zero, and the intensities of the AS - and S - components become close. At low temperatures, the intensity ratio of the components tends to zero: the absolute intensity of the AS component, for which the excited state of the molecule is initial, tends to zero as the temperature decreases, and the intensity of the S component tends to some final value.
1.1.6 Raman scattering of light as a method for studying matter
It is clear from the foregoing that Raman spectra can be used to measure the frequencies of natural vibrations of molecules and crystals. This opens up wide possibilities for the identification of substances and the study of the transformations occurring in them under the influence of external influences. Let's give some examples. One and the same substance can have several modifications, say, carbon is in the form of graphite, diamond, an amorphous phase. Chemical or spectral analyzes do not make it possible to distinguish between these phases, but the Raman spectra for them will differ, since not only chemical composition substance, but also its structure. With the help of RRS, one can study the processes of crystal melting and crystallization of liquids, explore chemical reactions in solutions, fix the appearance of thin films on the surface of solids and characterize their structure, etc. Changes in temperature, pressure, and other external factors lead to a change in the symmetry of the lattice of some crystals (structural phase transformations). The rearrangement of the crystal lattice naturally leads to a change in its vibrational spectrum, and Raman is a subtle tool for analyzing these transformations.
1.1.7 Experimental details
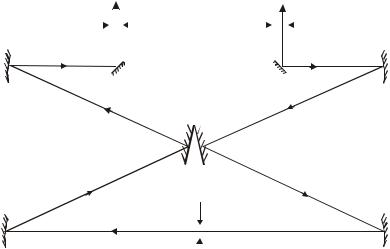
In this paper, we propose to record the Raman scattering spectrum of a liquid (one-component or a mixture of two liquids) and identify the studied substances from the measured vibration frequencies using a table that lists the vibrational frequencies of a number of molecules. The light source can be either a laser or line spectrum radiation from a mercury lamp, from which several lines of the blue region stand out. Each mercury line in this case gives its own Raman spectrum, and, naturally, these spectra are identical. The spectral device is a DFS-12 double diffraction monochromator, the light flux from which enters the photoelectric multiplier, is converted into an electrical signal, amplified and recorded by a self-writing potentiometer (Fig. 3). The wavelengths (photon energies) for mercury lines are well known, and they can serve as references for determining the dispersion of a spectral instrument (for spectrometers with diffraction gratings, the dispersion depends very weakly on the wavelength) and the energy distances between the exciting lines and their combination satellites.
More details about the details of the experimental setup, methods of conducting the experiment and deciphering the spectrum, as well as the requirements for the report, can be found directly in the laboratory.
DESCRIPTION OF THE DFS-12 SPECTROMETER
The optical scheme of the device is based on the principle of a double monochromator
The exit slit (1) is located in the focal plane of the mirror parabolic lens (3), the light to which is directed from the slit by a flat rotary mirror (2). The lens (3) directs a parallel beam onto the diffraction grating (4), the dispersed light is collected by the lens (5), in the focal plane of which an intermediate slit (6) is placed. monochromatic light, having passed the intermediate slit, which is simultaneously the entrance slit of the second monochromator, is directed by the mirror objective (7) to the diffraction grating (8) and, after secondary diffraction, is directed by the objective (9) and the rotary mirror (10) to the exit slit (11).
The double monochromatization scheme makes it possible to significantly increase the dispersion of the device and, in addition, significantly reduces the amount of scattered light inside the device.
AT In this device, the use of a diffraction grating of 600 lines/mm provides a linear dispersion at the exit slit in the blue region of the spectrum of 5Ǻ/mm at a focal length of 822 mm lenses.
Scanning along the spectrum is carried out by synchronous rotation of both gratings, either manually by the corresponding drum, or by an electric motor.
AT a photoelectric multiplier is used as a radiation receiver FEU-17. The PMT is powered by a high-voltage stabilizer through a voltage divider. The supply voltage is selected experimentally for
of each PMT, taking into account the most favorable signal-to-noise ratio, and can vary within 700-1100 V.
To improve the signal-to-noise ratio, a registration system is used in operation, which works on the principle of "photon counting".
When the photoelectrons are amplified, the PMT generates a pulse of negative polarity at the anode, the amplitude of which fluctuates within small limits. Pulses of smaller and larger amplitude are noise caused by autoelectronic and secondary emission from emitters, thermal noise of resistances, etc.
Amplifiers operating on " direct current”, amplify impulses of any amplitude.
The electronic counting registration system PR 14-M makes it possible to amplify pulses whose amplitude is within certain limits. Pulses of larger and smaller amplitudes are not amplified in the device. This improves the signal-to-noise ratio.
ILLUMINANT For excitation of Raman spectra of liquid and
For solid samples, an ISK-1 illuminator with a low-pressure spiral mercury lamp is used.
The light of a mercury lamp, passing through the test sample, is scattered by it and illuminates the slit of the device with the help of an illumination system.
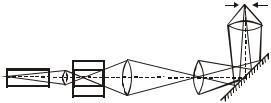
For a more complete use of the light scattered by the sample in the case of using cuvettes of medium and small sizes, the illuminator is provided with a projection system with an image separator, which makes it possible to illuminate the entire height of the slit of the device and completely fill its dispersive system with light.
When using cells (1) with a diameter of 18 mm, the lens (2) projects an image of the rear wall of the cell onto the condenser (3), which, in turn, projects an image of the front wall of the cell (with a magnification of 2x) onto the entrance slit of the spectrometer, a swivel mirror (4) and slit nozzle with lens
(5) projects the image of the condenser (3) into the plane of the diffraction grating of the spectrometer (with a magnification of 7.8x).
When working with cuvettes (6) with a diameter of 9–13 mm, a system consisting of a lens (7), a separator prism (8) and a lens (9) is placed directly behind the cuvette. The prism-separator divides the light beam coming from the cuvette into three strips, which are arranged sequentially one above the other.
The condenser (10) projects these strips onto the slit of the spectrometer, while the total magnification of the system is approximately 0.9-1.1X. Lenses (7), (9) project the rear wall of the cuvette onto the condenser (10), and lens (11) projects the image of the condenser into the plane of the diffraction grating of the spectrometer, while the magnification on the grating is 12.5-19X (Fig. 3).
The mercury lamp is powered by the EPS-94 power unit. Attention!!! Only a laboratory assistant can turn on the power supply unit.
ORDER OF WORK AND PRACTICAL INSTRUCTIONS.
In this work, it is necessary to record the Raman scattering spectrum of a liquid (a pure substance or a two-component mixture) and determine the substance or components of the mixture from the found frequencies.
Since the Raman scattering lines have a relatively low intensity, it is necessary to fully utilize the aperture ratio of the spectrometer. Checking the correct setting of the lighting system is carried out visually, using a microscope located behind the exit slit of the monochromator.
INTERPRETATION OF THE SPECTROGRAM Interpretation of the Raman spectrum is carried out by
measurements on a spectrogram or registergram of the coordinates of known mercury lines and Raman lines. With the help of a suitable interpolation formula, it is possible to determine the wavelength (wave number) of the latter from the wavelengths (wave numbers) of the known lines and the location of the line to be decoded relative to them. When there are many known lines in any region of the spectrum, so that the line under study is located within a narrow gap between two known lines, a simple linear interpolation formula can be used, but if the distances between them are large, more complex interpolation formulas are used.
A calibration curve can also be used to determine wavelengths. This is especially convenient if a device with a diffraction grating is used to obtain the spectrum, since in this case, the calibration graph plotted in wavelengths is well approximated by a straight line. (This is true if we are working with the first order of the spectrum, i.e., when the diffraction angles are not large.) This method should be used in this work. Having obtained a good registerogram, it is necessary to determine from it the coordinates of the lines of the mercury spectrum l and the coordinates of the lines of Raman scattering l kr .
Some lines in the spectrum of mercury are too intense, to determine their coordinates, proceed as follows: Let x 1 and x 2 be the coordinates of the symmetric Stokes and anti-Stokes lines of Raman scattering, then the coordinate of the exciting line
the wavelengths of the Raman scattering lines λcr are determined.
According to the conversion table λ → ν (ν ╪ 1/λ since λ is determined in air, and ν needs to be known for vacuum, the corresponding wave numbers ν kr are found.
AT In this work, the following mercury lines serve as exciting lines:
The belonging of the Raman scattering lines to one or another excitation line of mercury can be most easily determined knowing that the difference between the wave numbers of the satellites and the excitation lines must coincide with each other for all excitation lines. In addition, it should be taken into account that the intensity of the Raman line is proportional to the intensity of the exciting line, thus, knowing the ratio of the intensities of the mercury lines, it is possible to control the correctness of the interpretation by observing the ratio of the intensities of the Raman scattering lines. Knowing the ratio of intensities, we can approximately determine from which line we can still expect repetitions of combinational lines (see Table 2)
Differences of the wave numbers of the satellite and the exciting line, coinciding with each other, are outlined in black frames. Differences not surrounded by black frames are not combination frequencies and should not be taken into account.
AT the last column contains the found combinational differences of the wave numbers, and at the bottom of the table are the same differences, but with the intensities characterizing them (see column I). Indices b, s, dv, respectively, denote: b - wide, s - sharp, dv - double.
Having determined the combination frequencies, i.e. wave numbers of the substance under study, it is necessary to compare them with the frequencies of the Raman spectra of various substances and determine the substance or mixture of substances under study.
REQUIREMENTS FOR THE REPORT:
The report must contain:
1. An optical scheme of the installation with an indication of the path of the rays, both in the lighting system and in the spectrometer. When drawing, you must take at least three rays.
2. Conditions for obtaining a registerogram (slit width, scanning speed).
3. The graph from which the wavelengths of the Raman scattering lines were determined (i.e., a calibration graph on which the Raman lines are plotted, drawn on a reasonable scale).
4. A table of wavelengths for all Raman lines and their corresponding wave numbers (found from the λ→ conversion tables).
5. The average value of the frequencies of normal vibrations, indicating the errors.
6. The wavelengths of the excitation lines from which the satellites were received.
7. Values of relative intensities of combination lines on a ten-point scale.
8. name and formula of the test substance.
Literature:
1. Kolrausch K. "Spectra of Raman scattering", Moscow Central Library, 1952
2. Chulanovsky V.M. "Introduction to molecular spectral analysis", M-L GITTL, 1951
3. “Practical work on spectroscopy, edited by Professor L.V. Levshin, ed. Moscow State University, 1976
abbr., KR; cattle otherwise Raman scattering effect; Raman scattering; Raman effect(English) - inelastic light scattering (with a change in frequency/wavelength), accompanied by transitions of matter between vibrational energy levels.Description
Scattering of light, in which energy is exchanged between photons and matter, is called inelastic scattering or Raman scattering (Raman effect). A change in the photon energy results in a change in the wavelength (frequency) of the scattered light. Elastic scattering of light by matter is also observed, without changing the energy of photons and, consequently, the wavelength of light. An example of elastic scattering is Rayleigh scattering of light (the Rayleigh effect).
The Raman scattering (RS) mechanism is illustrated in Fig. . 1. Stokes CR is characterized by the fact that in the process of interaction with a molecule, a photon gives it part of the energy. As a result of such a process, the molecule passes from a level with a lower energy value to a level with a higher energy value, and the energy of the scattered photon decreases (the wavelength increases (Fig. 1, left)). Anti-Stokes RS is characterized by the fact that in the process of interaction with a molecule in an excited state, the photon energy increases, and the molecule passes into a state with a lower energy value (Fig. 1, right). For comparison, in Fig. 1 in the center shows a diagram corresponding to Rayleigh scattering, when there is no energy exchange between a photon and a molecule. On fig. 1b also shows the virtual energy level of a molecule in the field of a light wave (upper dotted line).
Since at thermodynamic equilibrium the population of the levels decreases with increasing energy, then with spontaneous Raman the frequency of anti-Stokes transitions is less than the frequency of Stokes ones - therefore, the intensity of the Stokes Raman lines in the spectrum is higher. Stokes Raman lines are located in the spectrum on the "red" side (from the side of longer wavelengths/lower frequencies) from the Rayleigh line. Not all transitions between different vibrational energy levels are possible.
The intensity of Raman scattering (RS) is 3–6 orders of magnitude lower than the Rayleigh one; therefore, to observe Raman spectra, an intense source of monochromatic radiation and a highly sensitive detector are required. Currently, they are mainly used as radiation sources. can be used to study the structure and composition of matter, its interaction with environment. Raman scattering bands can be characterized by the frequency, intensity, and degree of radiation depolarization. When optically anisotropic molecules are irradiated with polarized light, the scattered light will be partially depolarized.
When the frequency of the exciting light approaches and coincides with the frequency of the optical transition of the system, the situation of resonant RR (RR) is realized. The spectral features of Raman light provide information on the type of structure and interaction of the electronic and phonon subsystems in .
Raman scattering of light in condensed media has a number of features, since in solids the vibrations of molecules (atoms, ions) are strongly correlated and, in the case of crystals, they should be considered as vibrations of the crystal lattice as a whole.
The Raman spectra of amorphous light are more “smeared” than those of crystalline ones due to the disordering of the structure and a decrease in the regions of spatial correlations between particle vibrations (Fig. 2). A noticeable broadening of the lines is also observed in the Raman spectra of solid solutions and highly defective crystals.
Orientational disordering of solids associated with variations in the orientation of molecules in molecular crystals, dipoles in strongly polar crystals, and free electron pairs in ions of the Pb 2+ type can lead to broadening of spectral lines. The shift of the lines of the Raman spectra of silicate glasses serves as a measure of the degree of polymerization of silicate networks.
Raman spectroscopy is a very informative method for studying, in particular,: one can determine their geometric parameters, type of conductivity, etc.
When substances are heated, the intensity of anti-Stokes Raman lines noticeably increases (in contrast to Stokes lines), which makes it possible to use this effect for temperature measurements (corresponding fiber-optic sensors have been developed).
When the Raman is excited by high-power sources, the probability of Stokes scattering increases, and stimulated Raman scattering (SRS) occurs. Raman amplifiers are widely used in fiber-optic communications. Raman lasers make it possible to obtain powerful coherent radiation in spectral ranges in which there are no efficient lasers of another type.
Illustrations
The authors
- Veresov Alexander Genrikhovich
- Naniy Oleg Evgenievich
Sources
- Otto M. Modern methods analytical chemistry. - M.: Technosfera, 2008. - 544 p.
- Brundle C. R. et al. Encyclopedia of materials characterization. - Butterworth-Heinemann, 1992. - 782 p.
- Leng Y. Materials characterization. Introduction to microscopic and spectroscopic methods. - John Wiley & Sons, 2008. - 351 p.
- Nakamoto K. IR and Raman spectra of inorganic and coordination compounds. - M.: Mir. 1991. - 536 p.
- Abstreiter G., Cardona M., Pinchuk A. Scattering of light by excitations of free carriers in semiconductors. Scattering of light in solids. Issue. 4 / Ed. M. Cardona. - M.: Mir. 1979, pp. 12–182.
- Pentin Yu. A., Vilkov LV Physical methods of research in chemistry. - M.: Mir. 2003. - 683 p.
In 1928, Soviet scientists G. S. Landsberg and L. I. Mandelstam and at the same time Indian physicists Raman and Krishnan discovered the phenomenon that in the scattering spectrum that occurs when light passes through gases, liquids or transparent crystalline bodies, in addition to the unshifted line, there are new lines whose frequencies w are a combination of the frequency of the incident light and the frequencies ; vibrational or rotational transitions of scattering molecules:
![]()
This phenomenon is called Raman scattering of light.
On fig. 41.1 shows the Raman spectrum of oxygen excited by the line. A line (less intense than ) was superimposed on the Raman scattering line located to the right of the source line, as a result of which the intensity of this line turned out to be greater than the others. It can be seen from the figure that the Raman spectrum consists of an unshifted line symmetrically relative to which a number of satellites are located. Each "red" satellite (i.e., a satellite shifted towards longer wavelengths) with a frequency corresponds to a "violet" satellite with a frequency. At ordinary temperatures, the intensity of the violet satellites is much less than the red ones. As the temperature rises, the intensity of the violet moons increases rapidly.
According to quantum theory the process of light scattering can be considered as an inelastic collision of photons with molecules. In a collision, a photon can give to a molecule or receive from it only such amounts of energy that are equal to the differences of its two energy levels. If, upon collision with a photon, a molecule passes from a state with energy E to a state with energy, then the energy of the photon after scattering becomes equal to , where . Accordingly, the frequency of the photon will decrease by - a red satellite appears. If initially the molecule was in a state with energy, it can pass as a result of a collision with a photon into a state with energy E, giving excess energy to the photon.
As a result, the energy of the photon will become equal and the frequency will increase by The scattering of a photon can be accompanied by transitions of the molecule between different rotational or vibrational levels, etc. As a result, a number of symmetrically located satellites appear.
At ordinary temperatures, the number of molecules in the ground state far exceeds the number of molecules in excited states. Therefore, collisions accompanied by a decrease in the energy of the molecule occur much less frequently than transitions accompanied by an increase in energy. This explains the low intensity of the violet satellites compared to the red ones. As the temperature increases, the number of excited molecules increases rapidly, which leads to an increase in the intensity of the violet satellites.
The study of Raman scattering provides a lot of information about the structure of molecules. Using this method, the natural vibration frequencies of the molecule are determined; it also makes it possible to judge the nature of the symmetry of the molecule. In crystals, Raman scattering of light is usually associated with the so-called optical branch of crystal lattice vibrations (see Sec. 48). Raman spectra are so characteristic of molecules that they are used to analyze complex molecular mixtures, especially organic molecules, the analysis of which by chemical methods is very difficult or even impossible.
We note that Raman scattering is one of the so-called non-linear effects (see § 44).
Raman spectroscopy(Raman spectroscopy), a section of optical spectroscopy that studies the interaction of monochromatic radiation with matter, accompanied by a change in the energy of the scattered radiation compared to the energy of the (exciting) radiation incident on the object. Raman scattering (RS) is due to inelastic collisions of photons with (or ions), during which they exchange energy. By changing the photon energy, one can judge the change in the energy of the molecule, that is, its transition to a new energy level. Schematically, these transitions are shown in fig. 1. A molecule in an unexcited state with energy E 0 , under the action of a quantum with energy hv 0 (h-Planck constant, v 0 is the frequency of the incident quantum) is excited into an intermediate (virtual) state with energy E virt, from where it can either return to its original state by emitting a quantum hv 0 (Rayleigh scattering), or go into the state E i , emitting a quantum h( v 0 -v i), which leads to the appearance in the spectrum of scattered radiation of lines with frequencies v 0 -v i (Stokes lines). If before the absorption of a photon the molecule was in energy E i , then after light scattering it can go both to the initial state and to the ground state E 0 , then the energy
Rice. 1. Scheme of energy levels illustrating the basic principles of CR. The energy of the exciting light is hv 0 , the Raman lines have frequencies v 0 bv i .
scattered light increases, amounting to h(v 0 +
v i), which leads to the appearance of lines with frequencies v 0 +v i (anti-Stokes lines) in the spectrum. The energy state of a substance characterizes the difference between the energies of the exciting and scattered light E i +
h v i , that is, the most important characteristic of the Raman spectra is not the frequencies themselves, but their shift relative to the frequency of the Rayleigh line. The Stokes and anti-Stokes lines are arranged symmetrically with respect to the Rayleigh line and form the Raman spectrum; while the frequency shifts v i have values of 10-4000 cm -1 and coincide with the frequencies of the molecules observed in the IR absorption spectra.
The Raman spectrum, as a rule, is a vibrational spectrum. In the region of small values v i can manifest transitions between rotational levels (rotational Raman spectra), less often electronic transitions (electronic Raman spectra). Thus, the frequencies of the scattered light are combinations of the frequency of the exciting light and the vibrational and rotational frequencies of the molecules. At ordinary temperature, the Stokes lines are much more intense than the anti-Stokes lines, since most of the molecules are in the unexcited state; as the temperature rises, the intensity of the anti-Stokes lines increases due to the partial thermal population of the excited vibrational states E i . The intensity of the Stokes Raman lines is proportional to ( v o- v i) 4 at v o v el ( v el - the frequency of the electronic transition), and when v 0:v el sharply increases (resonant CR). For each particular Raman line, the intensity is a function of the molecules (a), in contrast to IR absorption, where the intensity is a function of the molecule (m). The value of the induced is determined by the expression
where E - tension electric field light wave, a, b, g polarizability of the I, II, III order. In the case of ordinary Raman scattering, the second and other terms of the expansion can be neglected, but at high intensities of the exciting light they are important. Differences in physical the nature of the processes of scattering and absorption of light is characterized by different. i.e., the same vibrations appear either in the IR or in the Raman spectra or have different intensities, for example, for molecules with a center of symmetry, vibrations active in the Raman spectrum do not appear in the IR spectrum and vice versa (alternative exclusion rule); vibrational and rotational frequencies of simple non-dipole molecules (H 2 , O 2 , N 2 , etc.), which are active in the Raman spectra, are absent in the IR spectra. Thus, the IR and Raman spectra complement each other.
With CR, a change in light occurs, characterized by the degree of depolarization r. When used for excitation (Fig. 2), the radiation of which is polarized in the plane hu, r=I z /I x , where I z and I x - intensities of the scattered light components polarized in the direction of the axes z and X respectively. For non-totally symmetrical vibrations (chaotic reference, molecules in or liquid phase) r=0.75 (depolarized lines in the spectrum); for
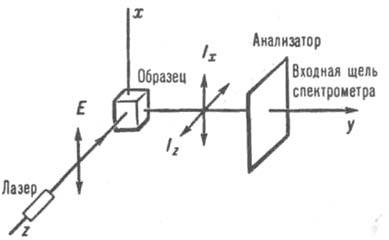
Rice. 2. Observation of the Raman spectrum at an angle of 90° upon excitation by polarized light.
fully symmetrical oscillations 0,"es":["KjSQ5nV7OwY"],"pt":["wI1AbSWkRrI","qrnoaBejNiA"],"it":["Pyp8AdnWlcQ"],"bg":["hvtteT_4jW8"],"ro ":["67j1OBU0EB4","67j1OBU0EB4","PeBKu1SPS5s","3CWdfVdkV7g"])


