What is the maximum kinetic energy. Test. Wave-particle duality
Test. Wave-particle duality
I option.
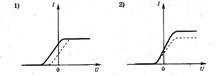
1. Four students were asked to draw general form graph of the dependence of the maximum kinetic energy of electrons emitted from the plate as a result of the photoelectric effect on the intensity of the incident light. Which drawing is correct?
2. The metal plate was illuminated monochromatic light the same intensity: first red, then green, then blue. In what case is the maximum kinetic energy emitted photoelectrons was the largest?
1) when illuminated with red light
2) when illuminated with green light
3) under blue light illumination
4) in all cases the same
3. What determines the maximum kinetic energy of photoelectrons knocked out of a metal during the photoelectric effect?
A. From the frequency of the incident light
B. From the intensity of the incident light
B. From the work function of the electrons from the metal
1) only B 2) A and B 3) A and C 4) A, B, C
4. With the photoelectric effect, the retarding potential difference does not depend on
A. Light frequency B. Light intensity
V. angle of incidence of light
1) A and B 2) B and C 3) A and C 4) A, B, C
1) will not change 2) will increase
3) decrease
II option.
1. The photocell is illuminated with light at certain frequencies and intensity. The figure on the right shows a graph of the dependence of the strength of the photocurrent in this photocell on the voltage applied to it. If the frequency is increased without changing the intensity of the incident light, the graph will change. Which of the following figures correctly shows the change in the graph?

2. The surface of the metal is illuminated with light, wavelength
which is less than the wavelength corresponding to the red border of the photoelectric effect for a given substance. With increasing light intensity
1) The photoelectric effect will not occur at any light intensity
2) the number of photoelectrons will increase
3) the energy of photoelectrons will increase
4) both the energy and the number of photoelectrons will increase
3. In the photoelectric effect, the work function of an electron from a metal depends on
1) incident light frequencies 2) incident light intensity
3) the chemical nature of the metal
4) kinetic energy of ejected electrons
4. In the photoelectric effect, the number of electrons knocked out by monochromatic light from a metal per unit time does not depend on
A. Incident light frequency B. Incident light intensity
B. work function of electrons from metal
Which statements are correct?
1) A and C 2) A, B, C 3) B and C 4) A and B
5. How will the minimum frequency change at which the photoelectric effect occurs if the plate is given a positive charge?
1) will not change 2) will increase
3) decrease
4) increase or decrease depending on the type of substance
Test. Corpuscular-wave dualism.
III. option.
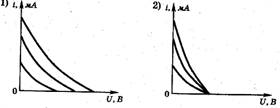
 1. The photocell is illuminated with light at certain frequencies and intensity. The figure on the right shows a graph of the dependence of the strength of the photocurrent in this photocell on the voltage applied to it. If the intensity of the incident light of the same frequency increases, the graph will change. Which of the following figures correctly shows the change in the graph? ?

2. In his experiments, Stoletov measured the maximum current strength (saturation current) when the electrode was illuminated with ultraviolet light. The saturation current strength with increasing incident light and its constant frequency will be
1) increase 2) decrease 3) stay the same
4) first increase, then decrease
3. The kinetic energy of electrons knocked out of the metal during the photoelectric effect does not depend on
A - frequencies of the incident light 2) B - intensity of the incident light
B - the area of the illuminated surface
Which statements are correct?
1) B and C 2) A and B 3) A and C 4) B and C
4. The energy of a photon absorbed by the photoelectric effect is equal to E. The kinetic energy of an electron emitted from the surface of a metal under the influence of this photon is
1) greater than E 2) less than E 3) equal to E
4) can be more or less E under different conditions
5. When the cathode of the vacuum photocell is illuminated by a stream of monochromatic light, photoelectrons are released. How will it change maximum energy emitted photoelectrons when the frequency of the incident light is reduced by a factor of 2?
1) will increase by 2 times 2) will decrease by 2 times
3) decrease by more than 2 times 4) decrease by less than 2 times
IV option.
1. Three experiments were carried out to measure the dependence of the photocurrent on the applied voltage between the cathode and the anode. The metal plate of the cathode was illuminated with monochromatic light of the same frequency but different intensity. Which of the figures correctly reflects the results of the experiments?
2. The intensity of the light incident on the photocathode decreased by a factor of 10. At the same time, the (-axis)
1) maximum speed of photoelectrons
2) maximum energy of photoelectrons
3) number of photoelectrons 4) maximum momentum of photoelectrons
3. With the photoelectric effect, the work function of an electron from a metal (the red border of the photoelectric effect) does not depend on
A - frequencies of the incident light B - intensities of the incident light
AT - chemical composition metal
Which statements are correct?
1) A, B, C 2) B and C 3) A and B 4) A and C
4. With an increase in the angle of incidence of monochromatic radiation with a constant wavelength on a flat photocathode, the maximum kinetic energy of photoelectrons
1) increases 2) decreases 3) does not change
4) increases at http://pandia.ru/text/80/136/images/image011_5.gif" width="15" height="20"><500 нм
5. Which graph corresponds to the dependence of the maximum kinetic energy of photoelectrons E on frequency 0 "style="border-collapse:collapse;border:none">
PHOTO EFFECT. CONSTANT DEFINITION
PLANCK AND ELECTRON WORK WORK
Purpose of the work: familiarization with the phenomenon of the external photoelectric effect and the determination of Planck's constant and the work function of electrons from the metal.
Electromagnetic radiation has a dual nature. When interacting with matter, it manifests itself as a stream of particles - photons with energy E and momentum P equal to
E = hν, Р = kh/2π. (one)
Under the influence of electromagnetic radiation, electrons can fly out of a substance. This phenomenon is called the photoelectric effect.
From the point of view of the quantum theory of light, the interaction of light with the electrons of matter can be considered as an inelastic collision of a photon with an electron. In such a collision, the photon is absorbed, and its energy is transferred to the electron. Thus, as a result of a single collision event, the electron acquires additional energy.
The kinetic energy of the electron is partially spent on making the exit A against the retarding forces acting in the surface layer of the substance, and the remaining part of the kinetic energy is the maximum kinetic energy of the emitted photoelectron. The Einstein equation describing the energy balance for the interaction of a photon with an electron has the form
hν = A + E max , (2)
where hν is the energy of the absorbed photon, A is the work function of the electron, E max is the maximum kinetic energy of the emitted photoelectron. It is assumed here that the kinetic energy of an electron in a substance before the absorption of a photon is much less than the photon energy.
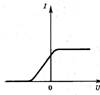
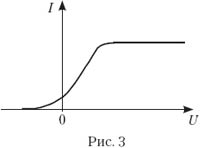
In the experimental study of the photoelectric effect, a two-electrode lamp-diode is used. One of the electrodes, the cathode, is illuminated by light of a certain frequency. The emitted photoelectrons reach the anode. At a fixed frequency and a constant power of the incident light, a typical dependence of the photocurrent strength I on the applied voltage U between the cathode and anode is shown in Fig. 1.
At some negative voltage U s called blocking voltage, the photocurrent vanishes. This is due to the fact that the maximum kinetic energy of the emitted photoelectrons E max is not enough to perform the work eU s against the retarding forces of the electric field between the cathode and anode (e is the electron charge). According to the Einstein equation (1), the value of U c for a certain photocathode is directly proportional to the frequency ν of the incident light
eU s \u003d E max \u003d hν - A. (3)
For each substance there is a minimum frequency ν min, above which the photoelectric effect can be observed. It is determined from the condition E max = 0 and is described by the formula
ν min \u003d A / h. (four)
The corresponding wavelength, called red border photo effect, is equal to
λmax = c/vmin , (5)
where c is the speed of light.
In this work, the experimental verification of the Einstein equation (2) for the photoelectric effect is carried out and the values of the Planck constant h and the electron work function А for the cathode material are measured.
Taking measurements
The scheme of the experimental setup is shown in Fig.2. Light from the source S through a system of optical filters F enters the photocathode K of the photocell F. Between the cathode K and the anode A, an adjustable retarding voltage U is supplied from the power supply B. The retarding voltage is measured with an electronic voltmeter V, the photocurrent is measured with a microammeter μA.
The frequency ν (wavelength λ) of the radiation incident on the photocell is controlled by the selection of light filters. The experiment consists in determining the dependence of the blocking voltage U c on the frequency of light hν. It is carried out as follows:
Turn on the illuminator and set a filter with a certain bandwidth.
Turn on the power supply and voltmeter.
By controlling the voltage of the power supply, remove the dependence of the photocurrent measured by a microammeter on the retarding voltage measured by a voltmeter.
Carry out similar measurements for other filters. Record the measurement results in Table 1.
Table 1
| λ average filter | No. of measurements | U | I |
| 1 | |||
| 2 | |||
| 3 | |||
| 4 | |||
| 5 | |||
| 1 | |||
| 2 | |||
| 3 | |||
| 4 | |||
| 5 | |||
| 1 | |||
| 2 | |||
| 3 | |||
| 4 | |||
| 5 |
Processing of measurement results is as follows:
Plot graphs of the dependence of the photocurrent I on the retarding voltage U for various values of the frequency of the incident light.
Extrapolating the obtained curves to their intersection with the U axis, determine the values of the blocking voltage U c for the used light frequencies (see Fig. 3). When extrapolating the curves, small values of the photocurrent should not be used.
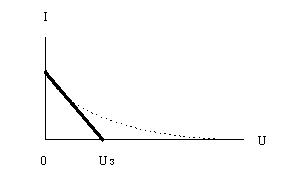
Fig.3
Enter the results of determining the blocking voltage in Table 2.
table 2
Using table. 2, to plot the dependence of the blocking voltage U z on the frequency of light ν. According to equation (3), the blocking voltage depends linearly on the light frequency
U c \u003d hν / c - A / e,
and the slope k of the slope of the straight line is equal to h/e. This allows us to determine Planck's constant by the formula
The coefficient k of the slope of the straight line is determined using the constructed dependence U c (ν).
Extrapolating the dependence graph U c (ν) to the intersection with the x-axis, determine the frequency ν min at which the blocking voltage vanishes. Determine the work function of electrons based on formula (4)
Estimate the measurement error of the work function DA.
test questions
What is the photoelectric effect?
What determines the maximum kinetic energy of the emitted photoelectrons?
What is the red border of the photoelectric effect?
How to evaluate the closing voltage?
Saveliev I.V. Course of general physics. M.: Nauka, v.3, ch.2.
Sivukhin D.V. General course of physics. Atomic and nuclear physics. part 1, M.: Nauka, ch.1.
O. E. Rodionova,
, Lyceum No. 34, Novokuznetsk, Kemerovo Region
Graphic tasks on the topic "Photoelectric effect"
This lesson can be carried out when repeating, consolidating, generalizing the topic, in preparation for the exam. Depending on the conditions of the educational institution, you can conduct a multimedia lesson or print assignments for each student. Some tasks can be performed using a computer. Before completing tasks, you should repeat the theory of the photoelectric effect and the graphics of linear and inverse relationships.
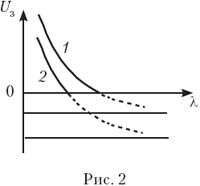
1. The figure shows a graph of the blocking voltage U h on the frequency ν of the irradiating light for two different materials of the photocathode. Justify the linearity of this dependence.
What is the physical meaning of the points of intersection of graphs with the x-axis? What is the physical meaning of the points of intersection of the continuation of the graphs with the y-axis? Which of the photocathodes has the highest work function? Why are the slopes of the graphs the same? ( Answer. tga = h/e.) What the dependency graph would look like U h from the wavelength λ? Plot it for two values BUT out. ( Answer. ![]() )
)
The graph is a hyperbola, shifted down along the x-axis (Fig. 2).
2. To study the photoelectric effect on lithium ( BUT out = 2.5 eV) a mercury lamp is used as a source of ultraviolet radiation. With the help of light filters, radiation of certain wavelengths can be isolated from its spectrum. Using the wavelengths given in the table, calculate the corresponding blocking voltage and the frequency of the incident light, and plot the blocking voltage versus the frequency of the incident light, U z (ν) (1 petahertz = 1 PHz = 10 15 Hz. - Ed.)
U h, v |
Answer.ν, PHz: 1.183; 0.958; 0.819; 0.688; 0.520;
U h, V: 2.4; 1.5; 0.9; 0.35; 0.
Using the graph, determine Planck's constant and compare its value with the table. Plot the blocking voltage against the wavelength of the incident light U h (λ).
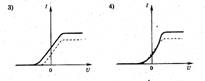
3. The photocell is illuminated with light of a certain frequency and intensity. On fig. 3 shows a graph of the dependence of the strength of the photocell photocurrent on the voltage applied to it. If the frequency is increased without changing the intensity of the incident light, the graph will change. Which of the ones shown in Fig. four, a–d graphs correctly reflect the change in this graph? (The original graph is shown in dotted lines.)
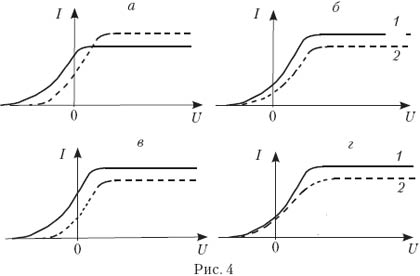
Answer. We call the correct answer A. The intensity of the incident light ( J) is determined by the ratio of the total energy of incident photons to the time interval and surface area on which they fall. As the photon frequency increases, a constant radiation intensity means a decrease in the number of photons. Therefore, if the quantum yield (the ratio of the number of photoelectrons to the number of incident photons in the same time interval) is considered constant, then with increasing n, the I us. But it is known that the quantum yield depends both on the properties of the photocathode material and on the frequency ν. So it is not worth giving such tasks at school. - Ed.
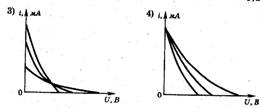
4. The photocell is illuminated with light of a certain frequency and intensity. On fig. 3 shows a graph of the dependence of the photocurrent on the voltage applied to the photocell. If the intensity of the incident light increases, the graph will change. Which of the graphs in Fig. four, a–d Is this graph correct? (The original graph is shown in dotted lines.)
5. On fig. four, b two volt-ampere characteristics of the same element are shown. Compare frequencies, light fluxes, maximum kinetic energies of photoelectrons corresponding to these characteristics.
(Answer:ν 1 \u003d ν 2, Ф 1 > Ф 2, E k1 = E k2 .)
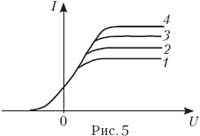
6. Volt-ampere characteristics are removed vacuum photocell(Fig. 5). The maximum number of photons incident on the photocathode per unit time corresponds to the characteristic:
A) 1; B) 2; AT 3; G) four; E) Does not depend on the number of photons.
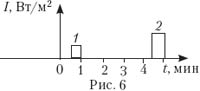
7. A metal plate is illuminated with a laser whose radiation frequency is 480 THz. The dependence of the pulse shape on time is shown in fig. 6. The photoelectric effect is observed in both cases. When is the maximum speed of photoelectrons greater?
A) in case 1 ;
B) In case 2 ;
AT) in both cases the speed is the same;
D) To answer you need to know the work function.
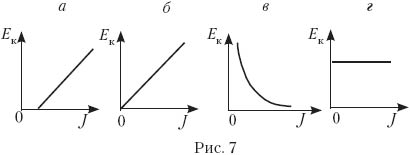
8. Four students were asked to draw a general view of the graph of maximum energy E to the electrons emitted from the plate as a result of the photoelectric effect, on the intensity of the incident light. Which of the ones shown in Fig. 7, a–d charts done correctly?
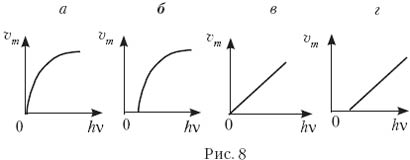
9. Which of the graphs in Fig. eight, a–d corresponds to the dependence of the maximum speed of photoelectrons on the energy of photons incident on the substance?
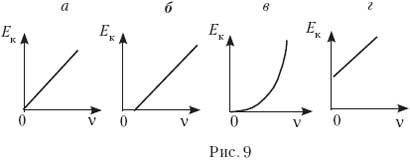
10. Which of the graphs in Fig. 9, a–d corresponds to the dependence of the maximum kinetic energy of photoelectrons on the frequency of the incident light?
11. Plot the photoelectron kinetic energy versus light frequency for sodium. The work function is 2.35 eV.
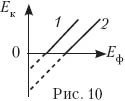
12. Show a graph of the dependence of the maximum energy of photoelectrons on the energy of incident photons for photocathodes with different work functions.
(Answer. See fig. ten: BUT out2 > BUT out1 .)
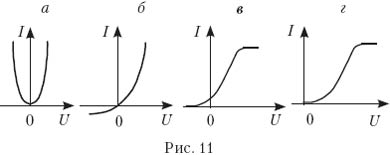
13. Which of the graphs in Fig. eleven, a–d Is the volt-ampere characteristic correctly depicted at constant illumination?
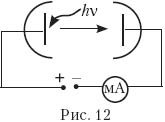
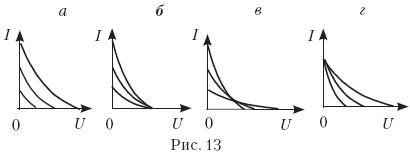
14. Three experiments were carried out to measure the photocurrent from the applied voltage between the photocathode and the anode (Fig. 12). In these experiments, the metal plate of the photocathode was illuminated with monochromatic light of the same frequency. Which of the Fig. 13, a–d Are the results of these experiments correct?
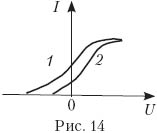 15.
Two photocathodes are illuminated by the same light source. In this case, the dependence of the photocurrent on the voltage between the cathode and the anode (voltage characteristic) for one cathode is shown by the curve 1
, for the other - a curve 2
(Fig. 14).
15.
Two photocathodes are illuminated by the same light source. In this case, the dependence of the photocurrent on the voltage between the cathode and the anode (voltage characteristic) for one cathode is shown by the curve 1
, for the other - a curve 2
(Fig. 14).
Which photocathode has the highest work function? Justify the answer.
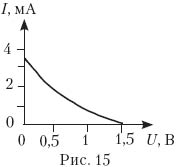 16.
The graph (Fig. 15) shows the dependence of the photocurrent on the applied reverse voltage when a metal plate (photocathode) is illuminated with electromagnetic radiation with a photon energy of 4 eV. What is the work function of this metal?
16.
The graph (Fig. 15) shows the dependence of the photocurrent on the applied reverse voltage when a metal plate (photocathode) is illuminated with electromagnetic radiation with a photon energy of 4 eV. What is the work function of this metal?
A) 1.5 eV; B) 2.5 eV;
C) 3.5 eV; D) 5.5 eV.
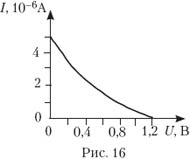 17.
Photoelectrons emitted from a metal plate are decelerated by an electric field. The plate is illuminated, the photon energy is 3.2 eV. On fig. 16 shows a graph of the dependence of the photocurrent on the blocking voltage. Determine the work function of electrons.
17.
Photoelectrons emitted from a metal plate are decelerated by an electric field. The plate is illuminated, the photon energy is 3.2 eV. On fig. 16 shows a graph of the dependence of the photocurrent on the blocking voltage. Determine the work function of electrons.
A) 1.2 eV; B) 2 eV;
C) 3.2 eV; D) 4.4 eV.
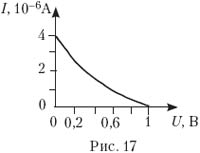
18. Photoelectrons fly out from the illuminated photocathode (work function 2.5 eV). On fig. 17 is a plot of photocurrent strength versus retarding field voltage. Determine the energy of photons incident on the cathode.
A) 1.5 eV; B) 2 eV;
C) 2.5 eV; D) 3 eV; D) 3.5 eV.
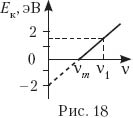
19. On fig. 18 shows a graph of the dependence of the maximum kinetic energy E k on the frequency ν of photons incident on the surface of the body. What is the energy of a photon with frequency ν 1 and the work function of an electron from the surface of the body?
A) 1.5 eV; 2 eV; B) 2 eV; 3.5 eV;
C) 2 eV; 1.5 eV; G) 3.5 eV; 2 eV.
Literature
- Rymkevich A.P. Physics assignment. 10-11 grades. – M.: Bustard, 2005.
- Stepanova G.N. Collection of problems in physics. 10-11 grades. – M.: Enlightenment, 2003.
- Turchina I.V. and others. 3800 tasks for schoolchildren and those entering universities. – M.: Bustard, 2000.
- Orlov V.A., Khannanov N.K. USE, control measuring materials-2002. – M.: Enlightenment, 2003.
- Gladysheva N.K. etc. Tests. Physics-10–11. – M.: Bustard, 2003.


